DORA's five software delivery metrics are change lead time, deployment frequency, failed deployment recovery time, change fail rate and deployment rework rate. The original four keys had no rework rate, and MTTR became failed deployment recovery time in 2023.
CI wall time 12.4mRuns per PR 2.5Test / verify activity 18h / week
Approve → merge28m per PR
The largest delay comes after approval: the work is ready, but the merge is still waiting.
Give the agent a clear merge rule: merge when approval and all required checks are green.About this sample
Sample from Zest’s pipeline report · Stage medians overlap and do not add up. Test / verify activity is a weekly session-flow estimate, not pipeline wall time.
USED BY ENGINEERING TEAMS AT
What are DORA metrics?
DORA (DevOps Research and Assessment), a research program run by Google Cloud, measures software delivery with five metrics in two groups. Throughput is how many changes move through the system; instability is how well deployments go. Measure them per application or service, not across a company:
DORA's five software delivery metrics, as dora.dev defines them (read October 5, 2026), with a formula for each over a chosen period.
Metric
Group
DORA's definition
Formula
Change lead time
Throughput
Time for a change to go from committed to version control to deployed in production
Median of deploy time minus commit time, over the commits deployed
Deployment frequency
Throughput
The number of deployments over a period, or the time between deployments
Successful production deployments per day or week
Failed deployment recovery time
Throughput
Time to recover from a deployment that fails and requires immediate intervention
Median of recovery time minus failed deployment time
Change fail rate
Instability
The ratio of deployments that require immediate intervention, likely a rollback or a hotfix
Deployments that needed a rollback or hotfix ÷ all deployments
Deployment rework rate
Instability
The ratio of deployments that are unplanned and happen because of an incident in production
Unplanned, incident-driven deployments ÷ all deployments
From four keys to five metrics
DORA's first study, in 2014, started from four measures: deployment frequency, lead time for changes, mean time to recover (MTTR) and change fail rate. Two changes since made the current five:
2023: MTTR, also called time to restore service, became failed deployment recovery time. The old definition mixed failures a change caused with outside ones, such as a data center outage; the new one counts only failures a deployment caused.
2024: deployment rework rate became the fifth metric, because change fail rate was acting as a proxy for rework. Reliability, which the 2021 report called a fifth metric, measures operations, not delivery.
How to compute DORA metrics from GitHub
When a GitHub Actions job references an environment, GitHub records a deployment and its statuses (queued, in_progress, success, failure and others). That is enough for deployment frequency and change lead time. The script below lists the successful production deployments since a date, then each deployed commit's lead time. Four things to know before you trust its numbers:
A failure status means the deploy job failed, not that the change failed in production. For change fail rate, mark the deployments that needed a rollback or hotfix, for example with a label on the fix's pull request, and divide by all deployments.
Recovery time and rework rate need incident data: when an incident started, which deployment caused it and which one fixed it. That lives in your incident tool, not in GitHub.
GitHub keeps a deployment's earlier statuses for 90 days, so store them if you want a longer history.
After a squash merge, the commit time on the default branch is the merge time, so this lead time runs from merge to production.
dora.sh (needs the GitHub CLI and jq)
REPO=owner/repo SINCE=2026-09-01

# 1. Successful production deployments since $SINCE: the commit and when it went live.
gh api --paginate "repos/$REPO/deployments?environment=production&per_page=100" \
  --jq ".[] | select(.created_at >= \"$SINCE\") | [.id, .sha] | @tsv" |
while read -r id sha; do
  gh api "repos/$REPO/deployments/$id/statuses" \
    --jq "map(select(.state == \"success\"))[0].created_at // empty" |
    sed "s/^/$sha /"
done | sort -k2 > deploys.txt

# Deployment frequency: successful deployments in the window.
wc -l < deploys.txt

# 2. Change lead time: deploy time minus commit time, for every commit each deployment shipped.
prev=""
while read -r sha at; do
  [ -n "$prev" ] && [ "$prev" != "$sha" ] &&
    gh api "repos/$REPO/compare/$prev...$sha" |
    jq --arg at "$at" '.commits[] | (($at | fromdate) - (.commit.committer.date | fromdate)) / 3600'
  prev=$sha
done < deploys.txt | sort -n |
  awk '{ h[NR] = $1 } END { print "median lead time (hours):", h[int((NR + 1) / 2)] }'
DORA metrics pitfalls
DORA lists its own, and four matter most:
Making a metric the goal. A target such as “every application deploys several times a day by year end” invites gaming (Goodhart's law).
One metric to rule them all. Track several, including some in tension with each other.
Comparing different applications, or teams against each other. The metrics fit one application or service at a time, and its context.
Measuring instead of improving. Precise data from many integrations may not be worth building; DORA suggests starting with conversations or its Quick Check.
How AI coding changes DORA metrics
DORA's 2025 report, State of AI-assisted Software Development, surveyed nearly 5,000 technology professionals, and 90% of them use AI at work. Unlike in 2024, more AI adoption went with higher software delivery throughput, but still with more instability.
DORA reads AI as an amplifier: without strong automated testing, mature version control and fast feedback loops, more change volume means more instability. Coding agents make each change cheaper to write, so they raise exactly that volume. DORA's usual first fix applies: smaller changes, which help throughput and stability at once.
What Zest measures next to DORA, and what it doesn't
Zest computes no DORA metric. Its GitHub App reads pull requests, reviews, comments and issues, not deployments, deployment statuses or incidents, so DORA stays with your CI/CD and incident tools. Zest covers the work before the commit:
The coding-agent sessions behind each change: agent, model, skills and MCP tools, per engineer, from Claude Code, Cursor, Codex, GitHub Copilot Chat, Grok Build and Hermes.
Which sessions led to which pull requests.
PR throughput and PR cycle time, defined on developer productivity metrics. Cycle time ends at the merge, where DORA's lead time still has the deploy to go.
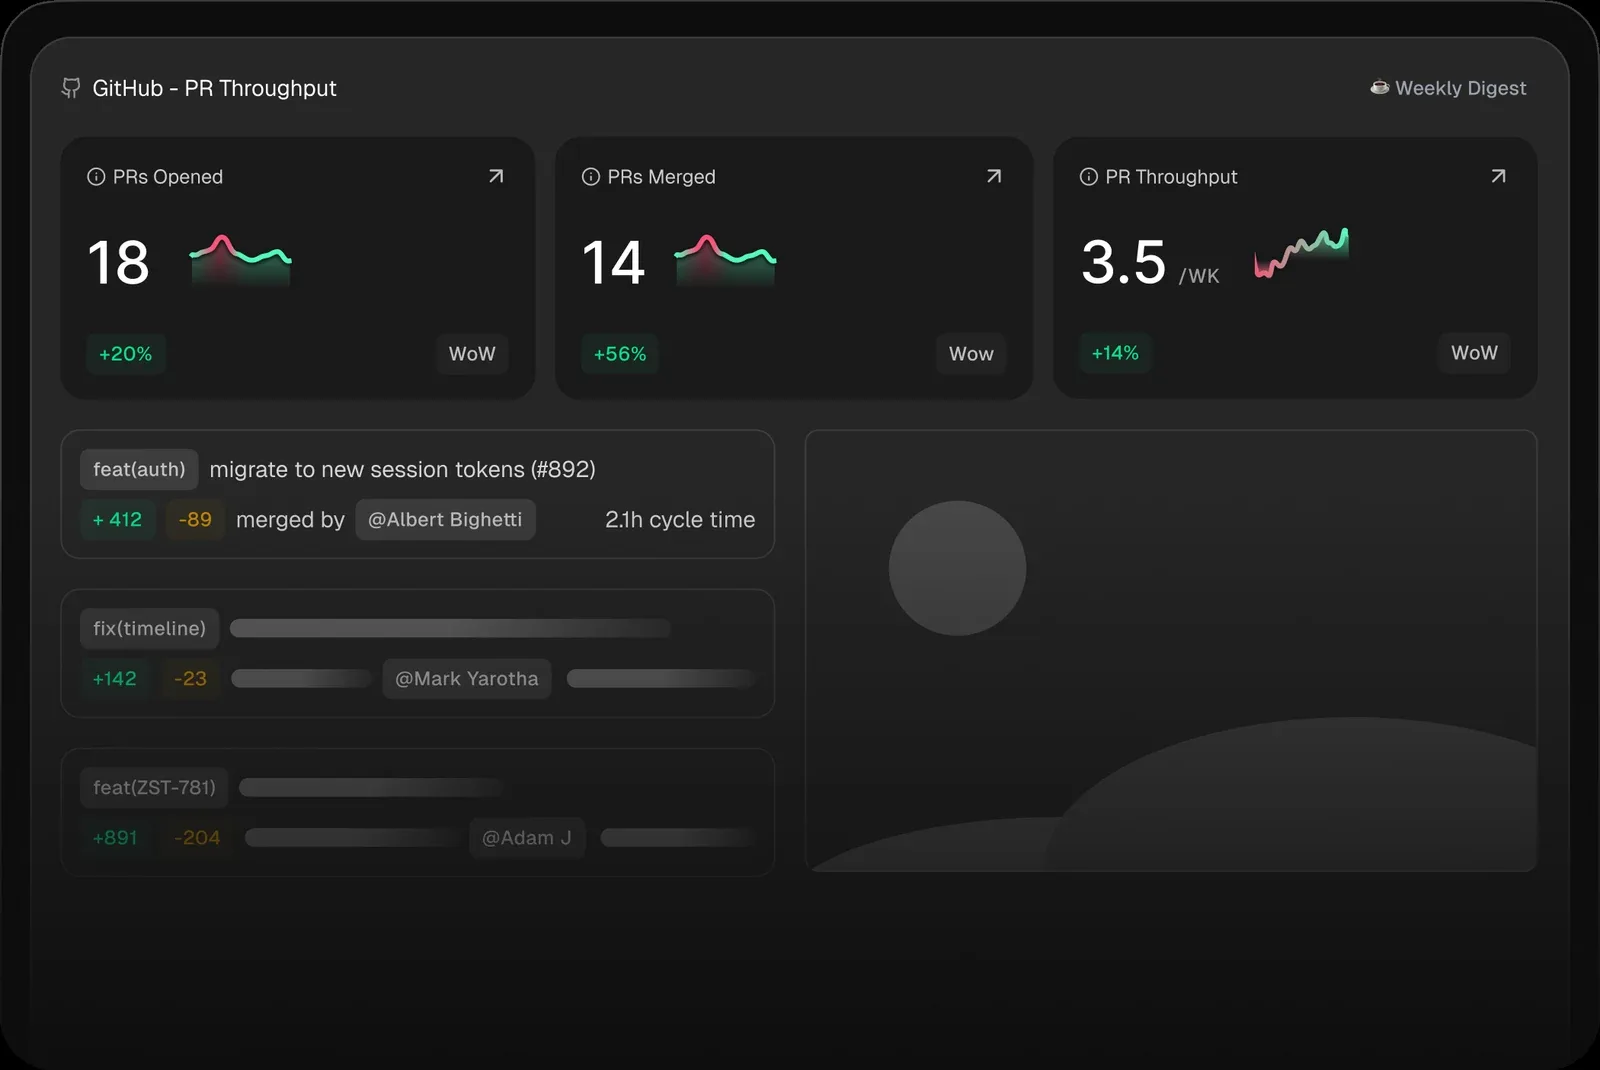
Zest's PR throughput
TRY IT ON YOUR TEAM
See what your team ships with AI.
Starter is free (3 seats, no credit card). Pro is $49 a month with 5 seats and Max is $149 a month with 10 seats — priced per workspace, not per engineer, with extra seats at $19 a month.
Deployment frequency, lead time for changes, change failure rate and time to restore service. DORA now uses five: it renamed time to restore as failed deployment recovery time in 2023 and added deployment rework rate in 2024.
Is MTTR still a DORA metric?+
No. Since 2023 DORA measures failed deployment recovery time, which counts only failures a deployment caused, not outages from outside causes.
What is the fifth DORA metric?+
Deployment rework rate, added in 2024: the ratio of deployments that are unplanned and happen because of an incident in production. DORA groups it with change fail rate under instability.
How do you calculate change failure rate?+
Divide the deployments that needed immediate intervention, such as a rollback or a hotfix, by all deployments in the period. Three such deployments out of 60 is a 5% change failure rate.
Does AI coding improve DORA metrics?+
In DORA's 2025 research, more AI adoption went with higher delivery throughput and still with more instability. DORA's advice is strong automated testing, mature version control and fast feedback loops.


 Winding / Agentic loop