
Engineering KPIs: 12 to Track in 2026, With Formulas
Related guide: Developer productivity metrics for AI-assisted teams
Engineering KPIs are the few numbers leaders review to see whether software ships faster, breaks less and goes to the right work. Most teams pair DORA’s delivery metrics with PR cycle time, a developer survey and, now that agents write much of the code, AI adoption and cost.
Zest shows which coding agents and models each engineer uses, what their sessions cost, and the pull requests they led to, next to PR throughput and cycle time. Start free
Below are 12 engineering KPIs with a formula for each, where the data comes from, which ones to skip, and what 866 agent-written pull requests from our own repositories show: when the median pull request merges 37 minutes after it opens, cycle time stops telling you much, and pull request size starts to. Zest sells AI coding analytics, so we have a stake in what teams measure. Outside claims link their source, and our own numbers come from one small team.
The 12 engineering KPIs, with formulas
The 12 engineering KPIs below cover delivery speed, stability, quality, developer experience, where time goes, and AI coding. Report each one per team or per service, over a fixed period, and watch the trend rather than a single reading.
| KPI | Group | Formula | Data from |
|---|---|---|---|
| Change lead time | Delivery | Median of deploy time minus commit time, over the commits deployed | CI/CD |
| Deployment frequency | Delivery | Successful production deployments per week | CI/CD |
| PR cycle time | Delivery | Median and 75th percentile of merged time minus opened time | Git host |
| PR throughput | Delivery | Merged pull requests per week, averaged over four weeks | Git host |
| Change fail rate | Stability | Deployments that needed a rollback or hotfix ÷ all deployments | CI/CD and incident tool |
| Failed deployment recovery time | Stability | Median of recovery time minus failure time, per failed deployment | Incident tool |
| Deployment rework rate | Stability | Unplanned deployments made because of a production incident ÷ all deployments | CI/CD and incident tool |
| PR size | Quality | Median lines changed per merged pull request | Git host |
| Developer experience score | Experience | Average answer to the same survey questions, each quarter | Survey |
| Time on new capabilities | Business | Engineering time on new features ÷ all engineering time | Issue tracker or survey |
| AI adoption | AI coding | Engineers who used a coding agent this week ÷ engineers with access | Each AI vendor’s admin view |
| AI cost per merged PR | AI coding | Coding-agent spend ÷ merged pull requests, per team | AI vendors’ usage data and Git host |
Nobody should track all 12 at once. The section on choosing below says how to pick three to five.
Delivery KPIs: lead time, deployment frequency, cycle time and throughput
Delivery KPIs say how fast a change moves from an engineer’s hands to production. Two of them are DORA metrics: change lead time and deployment frequency. DORA, the research program run by Google Cloud, says its metrics are “meant to be applied at the application or service level,” and that the goal is to improve over time, “not to compete against other teams or organizations” (dora.dev, last updated January 5, 2026).
PR cycle time is the Git host’s view of the same journey: from a pull request being opened to being merged. It stops at the merge, where change lead time still has the deploy to go. Report its median and 75th percentile, not the mean, because a few pull requests left open for weeks drag an average up. To find where the time goes, split it into pickup time (opened to first review) and review time (first review to merge). The developer productivity metrics guide has a GitHub CLI script that computes cycle time and pickup time; review time is the difference.
PR throughput counts merged pull requests per week. It is the easiest of the four to inflate, since an engineer or an agent can split one change into five, so read it next to PR size and never on its own.
Stability KPIs: change fail rate, recovery time and rework rate
Stability KPIs say how often shipping goes wrong and how long the damage lasts. DORA now lists five software delivery metrics, not the original four keys: it replaced mean time to recover with failed deployment recovery time in 2023, which counts only failures a deployment caused, and added deployment rework rate in 2024. DORA groups change fail rate and rework rate as instability (DORA metrics in full).
All three need incident data: which deployment caused an incident, when it started and which deployment fixed it. That lives in your incident tool, not in your Git host or CI. If your team has no incident process yet, change fail rate is the one to start with: label the pull requests that fix a bad deploy, and divide by all deployments.
PR size: the quality KPI that predicts the others
PR size, the median lines changed per merged pull request, is the quality KPI we would add first on a team that uses coding agents. An agent will happily write 2,000 lines in one change, and big changes are where review breaks down.
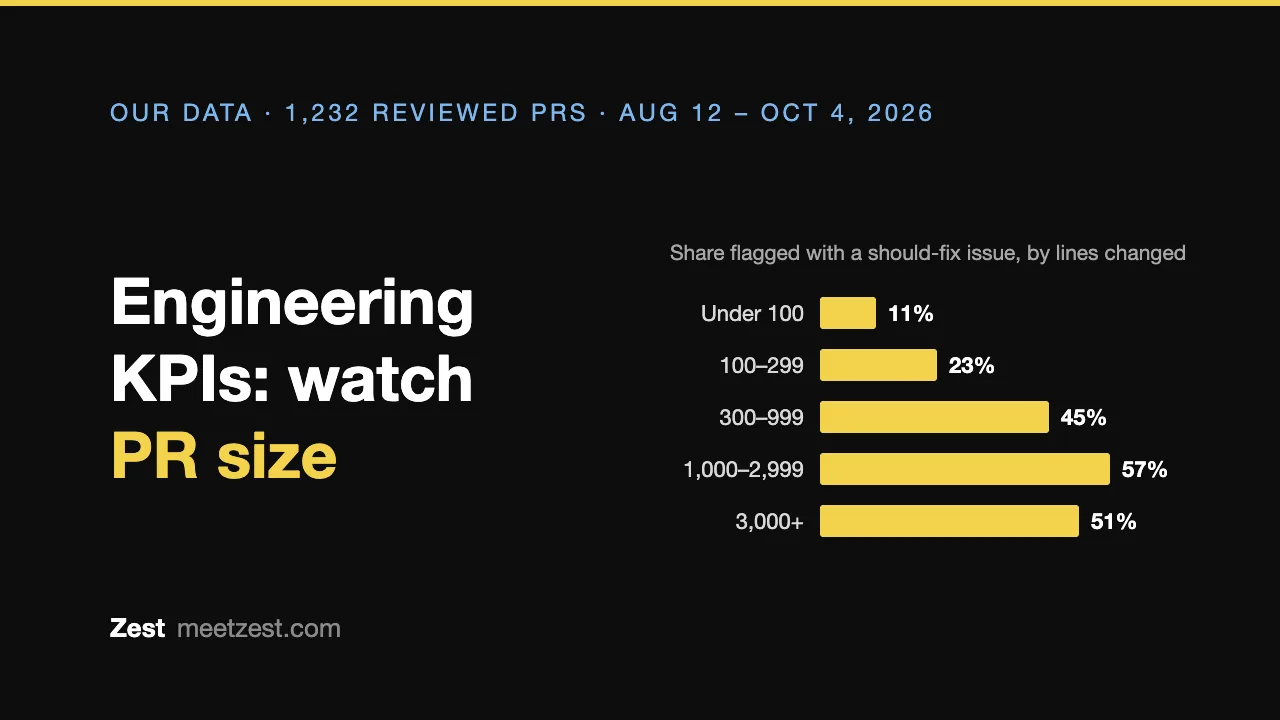
On our own repositories, every pull request gets a first pass from an AI code reviewer. Across 1,232 reviewed pull requests from August 12 to October 4, 2026, the share flagged with a should-fix issue rose with size:
| Lines changed | Pull requests | Flagged should-fix |
|---|---|---|
| Under 100 | 298 | 11% |
| 100–299 | 277 | 23% |
| 300–999 | 334 | 45% |
| 1,000–2,999 | 185 | 57% |
| 3,000 and more | 138 | 51% |
Above 3,000 lines the rate stops rising, partly because the reviewer reads a capped slice of a very large diff. Size predicted the flag far better than which model wrote the code: matched on repository, engineer and week, pull requests of 1,000 lines or more were flagged 36 points more often than those under 300. The method and the rest of the data are in what 866 agent-written pull requests show and which model writes the best code. Small changes also help DORA’s numbers: DORA’s usual first fix for both throughput and instability is to ship smaller changes.
Developer experience and business KPIs
Developer experience KPIs ask the engineers, because the system data can’t say whether the work is getting easier. The SPACE framework (GitHub and Microsoft Research, ACM Queue, 2021) says productivity “cannot be measured by a single metric or dimension.” It recommends metrics from at least three of its five dimensions, at least one of them a survey measure. A short survey with the same questions each quarter is enough to start. DX’s Developer Experience Index is one packaged version.
Business KPIs say whether engineering time goes to the work the company planned. The DX Core 4 groups its metrics into speed, effectiveness, quality and impact, and its key impact metric is the percentage of time spent on new capabilities, rather than on maintenance and other work. Most teams estimate it from issue-tracker labels or a survey question, because nobody logs hours by category.
AI coding KPIs: adoption, cost and what ships
AI coding KPIs answer one question: is the money spent on coding agents turning into shipped work? DX’s AI Measurement Framework splits it into three parts: utilization, impact and cost (DX). In practice that means three numbers:
- AI adoption. The share of engineers with access who used a coding agent this week. Each vendor counts “active” its own way, so compare a tool with itself over time, not with another tool.
- AI cost per merged PR. Coding-agent spend divided by merged pull requests, per team. It ties the bill to work that shipped, which a seat count or a token total can’t.
- The delivery KPIs you already track. Impact shows up in PR throughput, change fail rate and PR size, not in a separate AI score.
DORA’s 2025 report surveyed nearly 5,000 technology professionals, and 90% of them use AI at work. More AI adoption went with higher delivery throughput, and still with more instability (Google Cloud, September 23, 2025). That is why an AI KPI belongs next to a stability KPI, never alone.
Agents also change what the old KPIs mean. In our repositories, Claude Code wrote 95% of the 866 agent-written pull requests we studied, and the median one merged 37 minutes after it was opened. At that speed PR cycle time is no longer where the delay is. Review findings, rework and change fail rate are.
Which engineering KPIs not to use
The engineering KPIs to avoid are the ones that count activity, because activity is what coding agents make cheap:
- Lines of code and commit counts. An agent produces both on demand. SPACE warns that activity metrics should never be used on their own to reward or penalize developers.
- Token counts. One of our engineers used 67.9 billion tokens in a month, and 98.4% of them were cache reads. A token total measures how an agent works, not what ships: see why token counts mislead engineering teams.
- Story points compared across teams. Each team sizes points on its own scale, so one team’s 40 and another’s 40 mean different amounts of work. Within one team they still help plan: a sprint velocity calculator turns its recent sprints into a forecast.
- How much faster engineers say AI makes them. In METR’s randomized trial of 16 experienced open-source developers (July 2025), tasks took 19% longer with AI allowed, and the developers still believed AI had sped them up by 20% (METR).
- Any KPI turned into a ranking of people. DORA warns against using its metrics to compete across teams. DX marks diffs per engineer, one of its own Core 4 key metrics, “not at individual level,” and says it needs a counterweight such as its experience index and no targets or rewards tied to it.
How to choose 3 to 5 engineering KPIs
Choosing engineering KPIs starts from the question leadership is asking, then pairs a speed number with a number that would show the cost of going faster:
| If the question is | Track | Pair it with |
|---|---|---|
| Are we shipping faster? | Change lead time, deployment frequency | Change fail rate |
| Is review the bottleneck? | PR cycle time, split into pickup and review time | PR size |
| Is quality slipping? | Change fail rate, deployment rework rate | Failed deployment recovery time |
| Is AI paying off? | AI adoption, AI cost per merged PR | Change fail rate and PR size |
| Is the work getting harder? | Developer experience score | Time on new capabilities |
Three rules keep the set honest. Measure teams and services, not people. Look at trends month over month, not at one week. And don’t set a numeric target: a measure that becomes a target gets gamed (Goodhart’s law), which DORA lists among its own metrics’ pitfalls.
Where engineering KPI data comes from
Engineering KPI data sits in five places, and no single tool reads all of them:
- Your Git host for PR cycle time, throughput and size. GitHub’s API returns each pull request’s opened, reviewed and merged times and its lines changed.
- CI/CD for deployment frequency and change lead time. The DORA metrics guide has a script that reads GitHub deployments.
- Your incident tool for recovery time and rework rate.
- A survey for developer experience, and issue-tracker labels or a survey question for time on new capabilities.
- Each AI vendor’s admin view for adoption and spend: Claude Code, Cursor, Codex and GitHub Copilot each report only their own tool.
Software engineering intelligence platforms such as Jellyfish, LinearB, Swarmia and DX connect most of these sources and compute the delivery and stability KPIs for you. The eight platforms compared lists their prices and how each measures AI coding.
Zest is the narrowest option here. Its plugins record each coding-agent session (agent, model, tokens with an estimated cost at list prices, skills and MCP tools), and its GitHub App joins each session to the pull request it led to, next to PR throughput and PR cycle time. That covers AI adoption and the inputs to AI cost per merged PR, though its cost is an estimate, not your invoice. Zest computes no DORA metric, because it reads no deployments or incidents, and it runs no survey and holds no time-allocation data. Keep your CI/CD, incident and survey tools, or an SEI platform, for those.
Engineering KPI questions
What are engineering KPIs?
Engineering KPIs are the few measures leaders review regularly against a goal: how fast changes reach production, how often they break, whether engineers can work without friction, where time goes and, for teams using coding agents, what AI costs per shipped change.
What is the difference between an engineering metric and a KPI?
A metric is any measurement, and a team can collect hundreds. A KPI is one of the three to five metrics it has chosen to review against a goal. Change lead time is a metric for everyone. It becomes a KPI when a team decides that shortening it is what it is working on.
Are DORA metrics engineering KPIs?
Yes, they are the most common delivery and stability KPIs. DORA now uses five: change lead time, deployment frequency, failed deployment recovery time, change fail rate and deployment rework rate. DORA meant them for one application or service at a time, not for comparing teams.
How many engineering KPIs should a team track?
Three to five at a time. SPACE recommends metrics from at least three of its five dimensions, with at least one from a survey, and every speed KPI needs a stability or quality KPI beside it.
Should engineering KPIs be measured per engineer?
No. SPACE warns against using activity metrics on their own to reward or penalize developers, DORA warns against competing across teams, and DX marks its own diffs per engineer “not at individual level.” Measure teams and services.