
What 866 Agent-Written Pull Requests Show
Related guide: Claude Code analytics for engineering teams
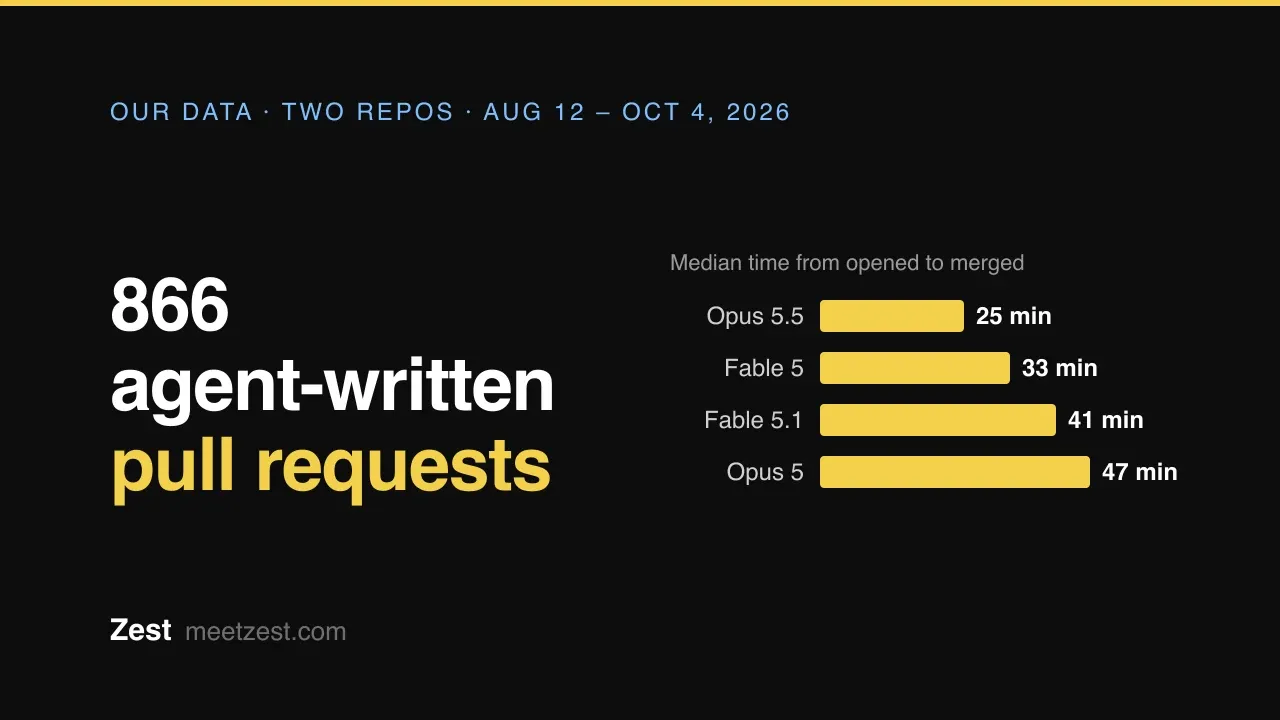
Claude Code wrote 95% of the 866 agent-written pull requests we studied, the median one merged 37 minutes after it was opened, and coding took only 43% of the agents’ session time. When our AI reviewer read them, the size of a pull request predicted its findings far better than the model that wrote it.
Every pull request a coding agent opens in our repositories ends with a short block the agent writes itself: the harness and model it ran on, the minutes it spent planning, coding and testing, the kind of task, and the test tools it ran. We started asking for that block on August 12, 2026. From then to October 4, 1,570 pull requests merged in our two main repositories, and 866 of them (55%) carry the block. This is what they show.
How we collected it
- Source: every pull request merged in our two main repositories from August 12 to October 4, 2026: 1,570 (1,228 in one repository, 342 in the other).
- The sample: the 866 of them that carry the agent’s Session Analytics block: 652 of 1,228 in one repository (53%), 214 of 342 in the other (63%). About three in four of the other 704 carry Claude Code’s signature too; the agent just didn’t add the block.
- Method: we parsed each block from the PR description and took the opened and merged times from GitHub.
Every number below counts those 866 PRs unless it says otherwise. Some fields in the block are optional, so the tables on session time and task types cover fewer.
Which harness wrote the PRs
| Harness | PRs | Share |
|---|---|---|
| Claude Code | 822 | 95% |
| Codex | 31 | 3.6% |
| Grok Build | 6 | 0.7% |
| Pi | 6 | 0.7% |
| Codex and Claude Code in one PR | 1 | 0.1% |
Claude Code is our default. All 31 Codex PRs merged in September.
Three models led in eight weeks
The model behind our Claude Code PRs, by month merged:
| Month | Claude Code PRs | Models |
|---|---|---|
| August (from the 12th) | 282 | Fable 5 151, Opus 5 115, Opus 4.8 11, Opus 4.6 3, Fable 5 then Opus 5 in one session 2 |
| September | 466 | Fable 5.1 255, Opus 5.5 139, Opus 5 34, Fable 5 25, Opus 4.8 13 |
| October 1–4 | 74 | Opus 5.5 74 |
By the dates of the first and last merged PR on each model:
- Fable 5 led August, from August 12 (when the block starts) to its last PR on September 2.
- Fable 5.1 took over on September 1 and ran until September 28.
- Opus 5.5 appeared on September 22. Every one of the 74 PRs merged in October ran on it.
- Opus 5, the other August regular, had its last PR on September 23.
So the model most of our PRs ran on changed twice in four weeks. A monthly number “per model” mixes models unless each session records which one it used.
Time from opened to merged
Median time from a PR being opened to being merged, for the Claude models with at least 100 PRs:
| Model | PRs | Median time to merge | Median size (lines changed) |
|---|---|---|---|
| Opus 5.5 | 213 | 25 min | 693 |
| Fable 5 | 176 | 33 min | 611 |
| Fable 5.1 | 255 | 41 min | 697 |
| Opus 5 | 149 | 47 min | 580 |
By harness, the medians were the same: 37 minutes for Claude Code (822 PRs) and 37 for Codex (31). Codex PRs were a little smaller, 576 lines changed against 691.
PR size doesn’t explain the order: the sizes are close, and Opus 5, the slowest to merge, had the smallest PRs. But this is not a model benchmark. Each model ran in different weeks, on different work, while our review habits and CI changed, and Opus 5.5’s PRs are the most recent. Read it as a reason to measure on your own team, not as a ranking. The next section shows what happened when we did control for the week.
Size predicts review findings more than the model does
Every pull request in these repositories also gets a review from IonWarp, our sister product’s AI code reviewer. Its first pass either finds nothing, leaves notes, or flags a should-fix or blocking issue. We expected the authoring model to drive that flag rate. It mostly didn’t.
Of 857 agent-written PRs with a block and a review, 717 have a readable first pass. The share flagged with a should-fix issue on that pass ranged from 23% (Codex) to 55% (Opus 5) by model. But each model dominated different weeks, and the reviewer itself changed week to week. So we compared models only within the same repository, engineer and week. Codex against Claude Code went from 21% against 27% before matching to +1 point after, with a 95% confidence interval of −16 to +20 (24 Codex PRs against 162 Claude Code PRs). Only one gap survived, and only just: in August, Fable 5 PRs were flagged 12 points less often than Opus 5 PRs (interval −26 to 0).
Size did not disappear. Across all 1,232 reviewed PRs with a readable first pass (release PRs left out):
| Lines changed | PRs | Clean | Notes only | Should-fix flag |
|---|---|---|---|---|
| Under 100 | 298 | 62% | 27% | 11% |
| 100–299 | 277 | 39% | 38% | 23% |
| 300–999 | 334 | 21% | 34% | 45% |
| 1,000–2,999 | 185 | 19% | 24% | 57% |
| 3,000 and more | 138 | 36% | 14% | 51% |
Matched on repository, engineer and week, PRs of 1,000 lines or more were flagged 36 points more often than PRs under 300 lines (interval +27 to +43). The gradient holds in August alone and in late September alone. Above 3,000 lines the flag rate stops rising, partly because each reviewer lane reads a capped slice of a very large diff.
What happens after the review: in the 30 days to October 4, 58% of reviewed PRs got at least one fix round from the coding agent. Of the 2,273 findings the agents answered in those rounds, they fixed 80%, declined 18% and handed 1.6% to a human. The decline rate was about the same for should-fix findings (16%) as for notes (20%). A decline is the agent’s call, not proof the finding was wrong.
We wrote up what this means for picking a model in Best model for coding: what 1,232 reviewed PRs show.
Where session time goes
398 blocks report minutes per phase, 24,666 minutes in total. These are the agents’ own estimates.
| Phase | Share of minutes |
|---|---|
| Coding | 42.7% |
| Local testing | 29.0% |
| Planning | 21.5% |
| Pushing and opening the PR | 5.7% |
| Waiting on CI | 0.9% |
| Deploying | 0.2% |
The median session behind one PR ran 48 minutes. The medians of each phase were 10 minutes planning, 20 coding and 14 testing (medians, so they don’t add up to 48). Coding is less than half of an agent’s session; planning and testing together take half. Waiting on CI is small mostly because only 16 blocks report any.
What the agents tested with
Test tools named across the 866 blocks: vitest 442 times, bun test 338, Playwright 237, pytest 119 and Claude in Chrome, which drives a real Chrome window, 86. A block can name several. Browser checks are not rare: Playwright and Claude in Chrome together come up 323 times.
What kind of work it was
456 blocks name a task type:
| Type | PRs | Share |
|---|---|---|
| Bug fix | 221 | 48% |
| Feature | 115 | 25% |
| Refactor | 50 | 11% |
| Infrastructure | 37 | 8% |
| Docs | 22 | 5% |
| Design | 7 | 2% |
| Other | 4 | 1% |
Half of the agent PRs that say what they are were bug fixes, and the agents shipped tests with them: 206 of the 221 bug fixes (93%) changed a test file. We matched each PR’s changed files from GitHub against test paths (.test., .spec., tests/, __tests__/, e2e/, test_*.py), so “changed” means touched, not newly written, and 104 PRs hit GitHub’s 100-file cap on the list. Across all PRs with a block, 86% touched a test file, against 61% of the PRs merged in the same weeks without one.
What we’d tell another team
- Record the model on every session. Ours changed twice in four weeks, so cost or speed “per model” goes stale fast unless the model is stored with each session.
- Budget for planning and testing, not just coding. Coding was 43% of our agents’ session minutes. Planning and local testing were half, and they burn tokens too.
- Compare models on your own merged PRs, in the same weeks. Our median time to merge ran from 25 to 47 minutes across four models on similar-sized PRs, but the gap in review findings mostly disappeared once we compared the same engineer, repository and week. A public leaderboard can’t tell you that about your codebase.
- Keep pull requests small. An agent will happily write 2,000 lines. Our reviewer flagged 11% of PRs under 100 lines and 57% of PRs between 1,000 and 3,000.
- Ask the agent to write the block. It costs a few lines in each PR description and gave us this data without any extra tooling.
Caveats
- One small team, two repositories. This is how Winding Labs works, not a sample of the industry.
- Self-reported minutes. The agent writes the block, so the minutes per phase are its estimate, not a measurement.
- Missing PRs. 704 of the 1,570 PRs merged in the window have no block and aren’t in the model numbers. Blocks that skip a field drop out of that table.
- Test files by path. A test file is matched by its path; a PR that changed a test helper elsewhere counts as no test, and one that only renamed a test counts as one.
- Our own reviewer. IonWarp is our sister product, and its format, models and strictness changed during the window. The review numbers come from a later pull of the same window (857 agent PRs with a review; 290 of 1,569 reviewed PRs had no readable first pass), so their counts differ slightly from the 866.
- Time to merge has many causes. Review, CI and the work itself matter as much as the model.
Zest records the harness, model and tokens of every session from its Claude Code and Codex plugins and joins each session to the pull request it led to, so you can see these numbers for your own team: Claude Code analytics, Codex analytics.