
Tokenmaxxing: Why Token Counts Mislead Engineering Teams
Related guide: Developer productivity metrics for AI-assisted teams
Tokenmaxxing is using as many AI tokens as you can because someone is counting them. It starts when a company treats token use as proof of AI adoption, through a leaderboard, a minimum spend or a line in performance reviews, and engineers respond by running more agents whether or not the work needs them. The bill goes up. What ships may not.
Zest shows each engineer's coding agents, models and tokens next to the pull requests those sessions led to, so you read usage against what shipped. Start free
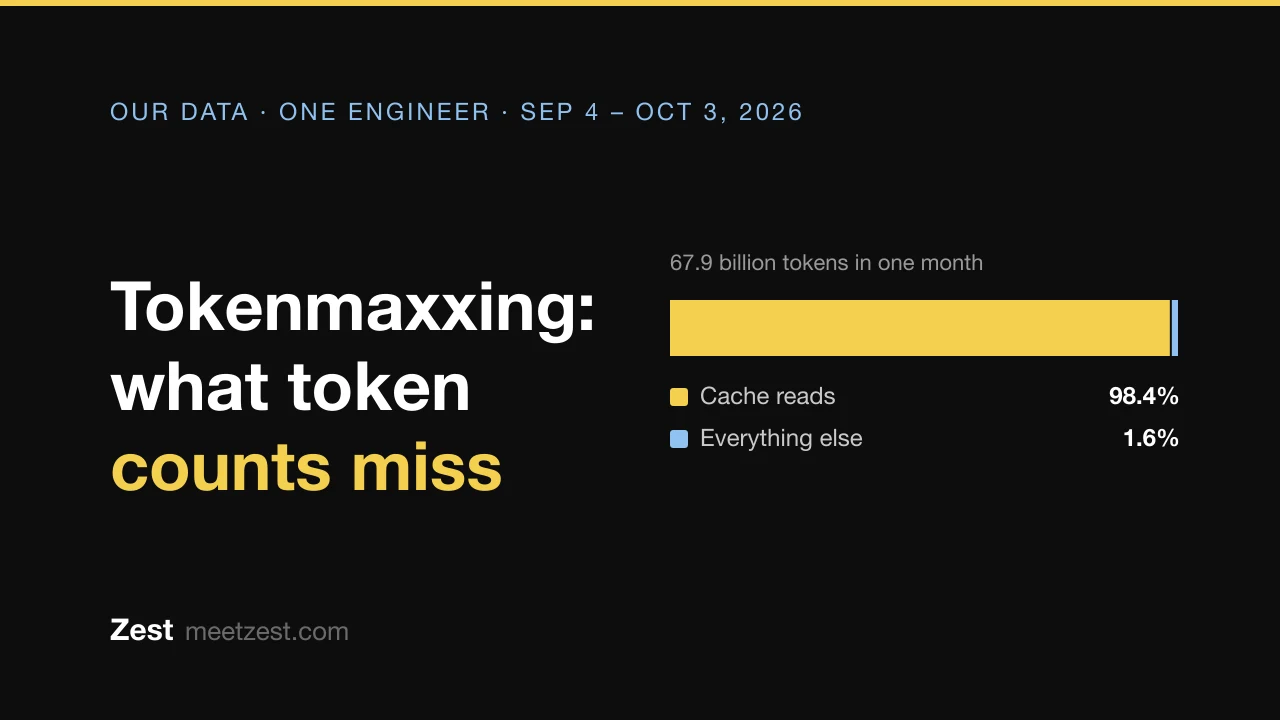
We use a lot of tokens ourselves: one of our engineers went through 67.9 billion in a month. Our data shows why that number tells you so little. 98.4% of those tokens were cache reads, and the model that used more tokens per merged pull request cost less. Zest sells AI coding analytics, so we have a stake in what teams measure. Every outside claim below links its source, and our own numbers come from one small team.
Where tokenmaxxing came from
The word spread in spring 2026 with reports from inside large tech companies:
- Meta. An employee built an internal dashboard called Claudeonomics that ranked the top 250 of more than 85,000 employees by token use, with titles such as “Token Legend” and “Cache Wizard”. Usage passed 60 trillion tokens in 30 days. The employee took it down two days after the news broke (Fortune via Yahoo Finance, April 9, 2026).
- Microsoft. An internal token leaderboard had run since January. Engineers described prototyping features they never planned to ship and using agents for tasks that are faster by hand, so they wouldn’t look like they used too little AI (The Pragmatic Engineer, April 23, 2026).
- Salesforce. A Mac widget showed each engineer’s AI spend against a minimum target, and a web tool showed any colleague’s spend. The reported message to staff: “use a minimum of $170/month tokens or be flagged” (The Pragmatic Engineer).
Not everyone went that way. Shopify built a token leaderboard in 2025, then renamed it a usage dashboard to discourage competition, and added circuit breakers that cut access when daily spend spikes. Those caught runaway agents and infrastructure bugs (same report).
By June the mood had turned. The Decoder, citing The Information, reported that a Meta memo warned of costs reaching billions and said people had no view of their own consumption, and that Meta planned to manage tokens with budgets and dedicated tools from 2027. CTO Andrew Bosworth wrote in a separate memo: “All motion is not progress and token usage alone is not a measure of impact of any kind” (The Decoder, June 13, 2026). Most of this comes from leaked memos and unnamed engineers, so treat the details as reported, not confirmed.
Why a token count is a bad metric
Four reasons, three of them from our own numbers.
Most tokens are the agent re-reading its own context
Here is one engineer’s Claude Code month: 318 sessions from September 4 to October 3, 2026, priced at Anthropic’s API list prices. That is not what we paid, since the engineer is on a subscription.
| Token type | Tokens | Share of tokens | Share of list-price cost |
|---|---|---|---|
| Cache reads | 66.88 billion | 98.4% | 57% |
| Cache writes | 0.98 billion | 1.4% | 33% |
| Output | 84.8 million | 0.12% | 10% |
| Fresh input | 1.17 million | 0.002% | under 0.1% |
The code the agent wrote is in the output row, about one token in 800. Nearly everything else is the conversation being sent again: Claude Code sends the full conversation with every request, so “a one-line question in a session that has been open all day still draws usage for the whole conversation” (Claude Code docs).
So a token count mostly measures how long sessions stay open and how much context they carry. The cheapest way up a token leaderboard is to never run /clear. Meta’s board had a title for it: Cache Wizard.
A token isn’t a unit of money
Claude Opus 5.5 lists at $0.20 per million tokens for a cache read and $20 per million for output, a 100x gap (Anthropic pricing, read November 4, 2026). Add them up as “tokens” and you have mixed cents with dollars.
Our 67.9 billion tokens came to $26,072 at list price, about $0.38 per million. The same tokens billed as fresh input would have been $370,526. Press estimates tend to use a figure near that second one: Fortune put Meta’s top user, at 281 billion tokens, at more than $1.4 million using a $5-per-million Opus 4.6 rate. At our blended rate that count is about $108,000. We don’t know Meta’s mix or what it pays, so this isn’t an estimate of its bill. It shows how wide the range is once you know only the token count.
More tokens can mean less cost
On the same engineer’s laptop, a merged pull request took 68 million tokens on Opus 5.5 and 47 million on Fable 5.1. By token count, Opus 5.5 looks 45% worse. In list-price dollars it cost $19 against $27, 30% less, and its PRs merged faster (our numbers by model). Those figures cover about half of that month’s tokens, so they compare the two models and aren’t the month’s full cost per PR. A leaderboard reads that the wrong way round.
It says nothing about what shipped
Tokens measure what went in. A merged pull request, a clean review or a bug that stays fixed is what came out. Gergely Orosz compares token counts to lines of code, the old metric that was easy to game, and the engineers he quotes describe exactly that: throwaway projects and agent runs nobody needed. Once a measure becomes a target, people optimize the measure.
What to measure instead
Token data is still useful as a cost input. Just put something next to it that says what the tokens bought.
| Measure | What it tells you | What we saw | Read it with care |
|---|---|---|---|
| Cost per merged PR, by model | What finished work costs | $19 on Opus 5.5, $27 on Fable 5.1 (one engineer, list price) | Different weeks hold different work |
| Review findings by PR size | Whether reviewers can keep up with what agents write | Should-fix flags on 11% of PRs under 100 lines, 57% at 1,000 to 2,999 lines (866-PR study) | Your reviewer’s strictness changes too |
| PRs needing a fix round | How much rework review triggers | 58% of reviewed PRs got at least one, in the 30 days to October 4 | Some rounds take a minute |
| People using each tool this week | Adoption, counted in people | 4 of our engineers used Codex in the 90 days to October 3, on 5% of merged PRs | Says nothing about value on its own |
| Daily spend per person, as an alert | Runaway agents and bugs | Shopify’s circuit breakers caught both | A big migration is a legitimate spike |
For a wider list, see our guide to developer productivity metrics for AI-assisted teams.
How to keep a usage dashboard from causing it
- Keep token use out of performance reviews and minimum-spend targets. If you want adoption, count who used a tool this week. Using it once a week is hard to fake and cheap to reach.
- Don’t rank people by tokens. Claude’s analytics dashboard includes a top-10 list, and Cursor’s Teams dashboard has a usage leaderboard every member can see. Use them to spot outliers, and don’t celebrate the top of the list.
- Cap spend instead of praising it. Claude Team owners can set spend limits for the organization and each member. Cursor Teams has a monthly limit for the team, a default per member and overrides. Codex workspaces buy credits with limits per seat type.
- Treat a spike as a bug first. Anthropic’s yardstick across enterprise deployments is about $13 per developer per active day, with 90% of users under $30 (docs). Alert well above your own baseline: our guide to Claude Code monitoring with OpenTelemetry has a query for it.
- Report cost next to output. A weekly line with spend, merged PRs and the share flagged in review is harder to game than any single number.
- Let engineers see their own numbers first. Meta’s memo named this gap. In Claude Code,
/usageshows what used your limits and suggests changes, and our guide to Claude Code token usage covers which of those changes save the most.
Is a heavy user a tokenmaxxer?
Not by the count alone. Our 67.9-billion-token month came with usage-limit notices on 16 of 29 active days, and those sessions opened 601 pull requests that merged. The same count could also mean a pile of abandoned prototypes. Only the denominator tells you which.
Zest records each engineer’s sessions, models and tokens with an estimated cost, and the Zest GitHub App joins sessions to the pull requests they led to. It has a per-engineer team view, and any per-person number can be misused, ours included. We’d point it at the questions above: what the work cost, what merged, and what needed fixing.
Caveats
- One small team. Our numbers come from two repositories and, for tokens, one heavy user’s laptop. They show how the metric behaves, not what your team should see.
- List price, not our bill. Every dollar figure of ours is what the tokens would cost on the API.
- Reported, not confirmed. The company stories rest on press reports of internal tools and memos.
Frequently asked questions
What does tokenmaxxing mean?
Tokenmaxxing means using as many AI tokens as possible to look productive or to meet a usage target, rather than because the work needs them. The term comes from “-maxxing” slang and spread in spring 2026 with reports about internal token leaderboards at Meta and Microsoft and spend targets at Salesforce.
Is using a lot of tokens the same as tokenmaxxing?
No. Long agent sessions on real work use a lot of tokens: 98.4% of one of our engineers’ 67.9 billion tokens in a month were cache reads, and those sessions opened 601 merged pull requests. It becomes tokenmaxxing when the tokens are the goal.
Did Meta stop tokenmaxxing?
Reports say it is moving away from it. The Claudeonomics dashboard came down in April 2026. In June, The Decoder, citing The Information, reported that Meta plans to manage tokens with budgets and dedicated tools from 2027, and quoted CTO Andrew Bosworth: “token usage alone is not a measure of impact of any kind.”
Why is token usage a bad productivity metric?
Most tokens are context being re-read, prices per token differ 100x by type, and the count says nothing about what merged. In our data the model that used 45% more tokens per merged pull request cost 30% less. It is also easy to game, as lines of code were.
What should engineering leaders track instead of tokens?
Cost per merged pull request by model, review findings by pull request size, the share of pull requests that need a fix round, how many people use each tool each week, and spend spikes per person as an alert rather than a score.
How much should AI coding tokens cost per developer?
Anthropic puts Claude Code at about $13 per developer per active day and $150 to $250 per developer per month across enterprise deployments, with 90% of users under $30 per active day. Start from your own baseline with a small pilot. See Claude Code pricing for the plans.