
Claude Code Monitoring: OpenTelemetry Setup and Queries
Related guide: Claude Code analytics for engineering teams
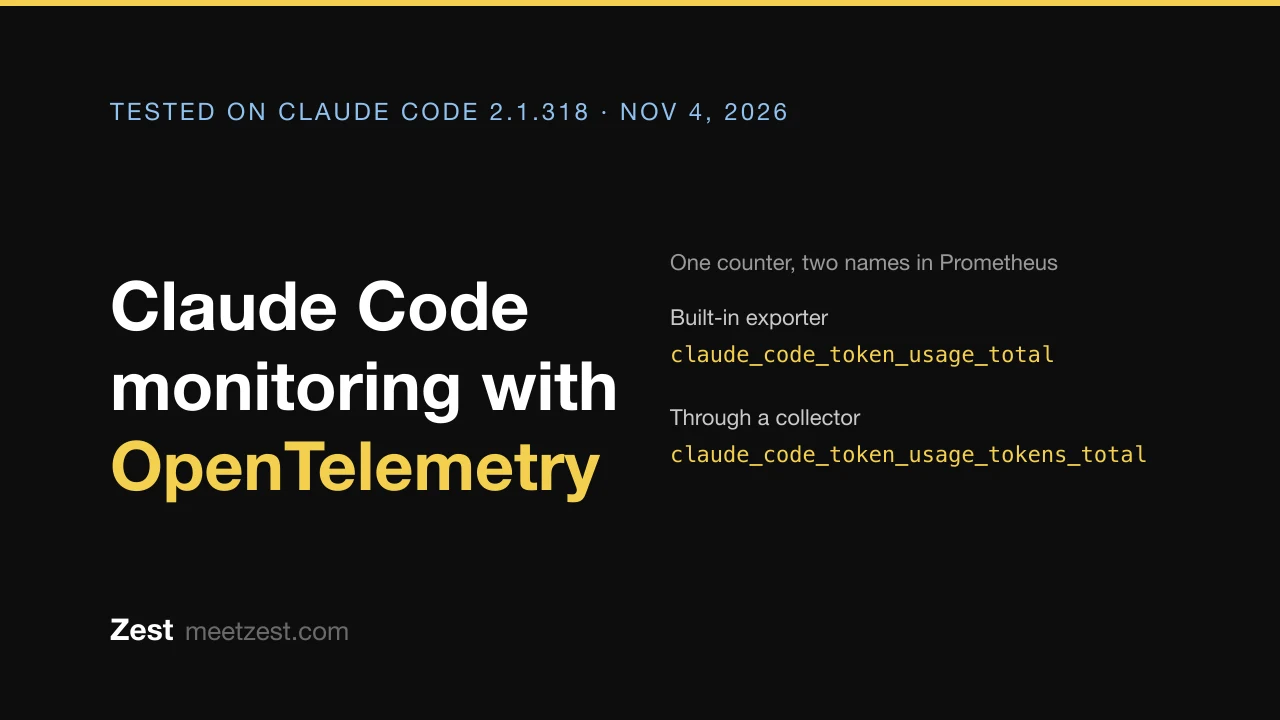
To monitor Claude Code across a team, turn on its built-in OpenTelemetry export with CLAUDE_CODE_ENABLE_TELEMETRY=1, send it to a collector you run, and roll the settings out through managed settings. You then get tokens, estimated cost, sessions, commits and pull requests per engineer in your own Prometheus, Grafana or Datadog.
Don't want to run a collector? Zest shows each engineer's Claude Code sessions, models, tokens and estimated cost next to the pull requests they led to. Start free
We ran the setup below end to end on Claude Code 2.1.318 with OpenTelemetry Collector 0.164.0 and Prometheus 3.15.1, ran every query, and compared the totals with what Claude Code reported for the same runs. That turned up two traps the docs don’t spell out: metric names change depending on the path, and the usual Prometheus query, increase(), read $0 on short sessions, while the obvious fix undercounted by half or more. Both are covered below, with the setup that matched.
If you only want the numbers without running anything, start with the four ways to see team usage. This post is for teams who want the data in their own stack.
Which Claude Code monitoring option you need
| Option | Who gets it | What it shows | Effort |
|---|---|---|---|
/usage |
Everyone | One machine: tokens, cost estimate, what used your limits | None |
| Analytics dashboard, claude.ai/analytics/claude-code | Team and Enterprise | Daily active users, sessions, contribution metrics | None |
| Spend report CSV | Team and Enterprise, once usage credits are on | Tokens and estimated spend per user and model, updated daily | Manual export |
| Enterprise Analytics API | Enterprise | Per-user usage and cost across Claude surfaces | Script |
| Console dashboard and Claude Code Analytics API | Claude Console (API) organizations | Daily per-user metrics, with an Admin API key | Script |
| OpenTelemetry | Every setup, cloud providers included | Per-user tokens, cost and tool activity, near real time | Collector and backend |
| LLM gateway | Any | Spend per key, budgets, logs | A proxy to run |
Source: Anthropic’s cost docs. OpenTelemetry is the only one that streams per-user numbers into your own stack in near real time, and on Bedrock, Google Cloud or Foundry it is one of the few options at all, since the analytics dashboards don’t see that traffic.
Searching for “Claude Code monitor” also turns up the Monitor tool, which is something else: it runs a command in the background and feeds each output line back to Claude mid-conversation (tools reference). It watches your logs for Claude. This post is about watching Claude Code.
Step 1: try it on one machine
Telemetry is off by default. The quickest test needs no collector: Claude Code can serve Prometheus metrics itself, on port 9464.
export CLAUDE_CODE_ENABLE_TELEMETRY=1
export OTEL_METRICS_EXPORTER=prometheus
claude
Then, while a session is running, in another terminal:
curl -s localhost:9464/metrics | grep '^claude_code'
That confirms the data exists. It isn’t a team setup, because each laptop would serve its own port only while a session runs.
Step 2: run a collector
Engineers’ laptops push to one collector over OTLP, and Prometheus scrapes the collector. This is the config we tested. We bound it to 127.0.0.1 on one machine, and a team’s collector has to listen on an address laptops can reach:
# otel-collector.yaml
receivers:
  otlp:
    protocols:
      grpc:
        endpoint: 0.0.0.0:4317
      http:
        endpoint: 0.0.0.0:4318
processors:
  batch: {}
exporters:
  prometheus:
    endpoint: 0.0.0.0:8889
  debug:
    verbosity: basic
service:
  pipelines:
    metrics:
      receivers: [otlp]
      processors: [batch]
      exporters: [prometheus]
    logs:
      receivers: [otlp]
      processors: [batch]
      exporters: [debug]
# prometheus.yml
scrape_configs:
  - job_name: otel-collector
    static_configs:
      - targets: ["otel-collector:8889"]
The debug exporter only prints that log events arrived. Swap it for Loki, Elasticsearch or your log store when you want to keep them.
This config has no TLS and no authentication. Keep ports 4317, 4318 and 8889 on a private network or VPN, or put a proxy in front. Port 8889 serves every engineer’s email and cost to anyone who can reach it, and anyone who can reach 4317 or 4318 can push fake usage.
Step 3: roll it out through managed settings
Asking every engineer to export variables doesn’t last. Put them in the env block of the managed settings file, so they apply to everyone:
{
  "env": {
    "CLAUDE_CODE_ENABLE_TELEMETRY": "1",
    "OTEL_METRICS_EXPORTER": "otlp",
    "OTEL_LOGS_EXPORTER": "otlp",
    "OTEL_EXPORTER_OTLP_PROTOCOL": "grpc",
    "OTEL_EXPORTER_OTLP_ENDPOINT": "https://otel.example.com:4317",
    "OTEL_EXPORTER_OTLP_HEADERS": "Authorization=Bearer your-token",
    "OTEL_EXPORTER_OTLP_METRICS_TEMPORALITY_PREFERENCE": "cumulative"
  }
}
Two details from the monitoring docs: Claude Code ignores these exporter variables in a repository’s .claude/settings.json, so a repo can’t redirect your telemetry. And exporter selectors such as OTEL_METRICS_EXPORTER aren’t locked by managed settings unless you set them there, so set them.
The last line is part of the fix for trap 2, below. The https:// endpoint and the bearer header assume a proxy in front of the collector that terminates TLS and checks the token. On a private network with no proxy, use http:// and drop the header.
The metrics Claude Code exports
| OpenTelemetry metric | Unit | Useful labels | What it counts |
|---|---|---|---|
claude_code.token.usage |
tokens | type (input, output, cacheRead, cacheCreation), model, query_source, effort, agent.name, skill.name, mcp_server.name |
Tokens per request |
claude_code.cost.usage |
USD | the same, minus type |
Estimated cost |
claude_code.session.count |
count | start_type |
Sessions started |
claude_code.active_time.total |
seconds | type (user, cli) |
Active time |
claude_code.lines_of_code.count |
count | type (added, removed), model |
Lines changed |
claude_code.commit.count |
count | Commits made through Claude Code | |
claude_code.pull_request.count |
count | Pull requests created through Claude Code | |
claude_code.code_edit_tool.decision |
count | tool_name, decision, language |
Accepted and rejected edits |
Every metric also carries user.email when known, organization.id and session.id, among others. Log events (claude_code.api_request, claude_code.tool_result, claude_code.user_prompt and more) add per-request detail. Anthropic says the cost metrics are approximations, computed at list price unless you set the modelPricing managed setting to your contracted rates.
Trap 1: the metric names depend on the path
This is what Prometheus showed us for the same counters:
| OpenTelemetry metric | OTEL_METRICS_EXPORTER=prometheus (direct) |
OTLP through a collector |
|---|---|---|
claude_code.token.usage |
claude_code_token_usage_total |
claude_code_token_usage_tokens_total |
claude_code.cost.usage |
claude_code_cost_usage_total |
claude_code_cost_usage_USD_total |
claude_code.active_time.total |
claude_code_active_time_total |
claude_code_active_time_seconds_total |
claude_code.session.count |
claude_code_session_count_total |
claude_code_session_count_total |
The collector adds the unit, including the capitalized USD. A dashboard you import, such as this community one on Grafana, expects one set of names, so check which before you decide it’s broken. The labels change too: user.email becomes user_email.
Trap 2: increase() misses short sessions, and the obvious fix undercounts
By default each metric carries session.id, so every session is a new Prometheus series. increase() needs two samples in a series and doesn’t count a series’ first value, so short sessions vanish.
The obvious fix is OTEL_METRICS_INCLUDE_SESSION_ID=false, so that sessions share one counter. Don’t use it on this path. We checked each setup against the cost Claude Code itself reported for the same runs, with several sessions running at once:
| Setup | Cost Claude Code reported | What Prometheus showed |
|---|---|---|
Session IDs on, increase() |
$0.00748 | $0 |
Session IDs off, increase() |
$0.01122 | $0.00538 |
| Session IDs off, the counter itself | $0.01122 | $0.00269 |
Session IDs on, max_over_time() |
$0.00748 | $0.00748 |
Session IDs on, max_over_time(), a session that pauses, delta |
$0.00614 | $0.00551 |
Session IDs on, max_over_time(), a session that pauses, cumulative |
$0.00174 | $0.00174 |
Each row’s cost differs because the runs hit the prompt cache differently. Compare within a row.
Two things explain it. The collector’s Prometheus exporter only adds a delta when its start time lines up with the last point it stored, and otherwise replaces the value (source). Separate processes sharing one series don’t line up. And the exporter forgets a series after metric_expiration, 5 minutes by default, so with deltas a session that pauses longer than that restarts from zero. In the pause test we set it to 5 seconds, to make a 12-second pause stand in for a long one.
What matched: keep session IDs on, set OTEL_EXPORTER_OTLP_METRICS_TEMPORALITY_PREFERENCE=cumulative, and query with max_over_time(), which takes the highest value each session reached.
It has three limits:
- A resumed session undercounts. It keeps its ID and restarts its counter, so you get only the larger stretch: $0.00222 of $0.00247 in our test.
- A session that started before the window counts in full.
- It’s one set of series per session. Our heaviest engineer ran 318 sessions in a month, and each carries several label combinations. Fine for a small team’s Prometheus. A larger team should check series limits or use a backend built for high cardinality, such as Honeycomb or Datadog.
So treat these numbers as estimates for budgeting, and use your invoice for the actual bill.
Queries worth having
These use the collector’s names and ran on our test setup. Our test had one user, so the per-person queries ran but didn’t exercise a real team.
Estimated cost per engineer, last 7 days:
sum by (user_email) (max_over_time(claude_code_cost_usage_USD_total[7d]))
Cost by model, to see what a model switch did:
sum by (model) (max_over_time(claude_code_cost_usage_USD_total[7d]))
Cost by source, which separates the main conversation from subagents and other auxiliary requests:
sum by (query_source) (max_over_time(claude_code_cost_usage_USD_total[7d]))
Tokens by type, then the cache-read share. In our measured month it was 98.4%:
sum by (type) (max_over_time(claude_code_token_usage_tokens_total[7d]))

sum(max_over_time(claude_code_token_usage_tokens_total{type="cacheRead"}[7d]))
  / sum(max_over_time(claude_code_token_usage_tokens_total[7d]))
Engineers active this week:
count(sum by (user_email) (max_over_time(claude_code_token_usage_tokens_total[7d])) > 0)
A spend alert. Anthropic’s figure is about $13 per developer per active day, with 90% of users under $30 (docs), so set the line well above your own normal day. $100 here is a placeholder, and our test never reached it, so we only saw the query run and return nothing:
sum by (user_email) (max_over_time(claude_code_cost_usage_USD_total[1d])) > 100
Use these to find runaway sessions and to plan budgets. Don’t turn the first one into a ranking. We explain why in why token counts mislead engineering teams.
What it logs, and what it doesn’t
By default, Claude Code redacts prompt text and assistant responses from events, and leaves out tool parameters, tool output and raw API bodies. You opt in with OTEL_LOG_USER_PROMPTS=1, OTEL_LOG_TOOL_DETAILS=1, OTEL_LOG_TOOL_CONTENT=1 and OTEL_LOG_RAW_API_BODIES, and the raw bodies include the full conversation history. OTEL_LOG_USER_PROMPTS=1 also turns on assistant responses, unless you set OTEL_LOG_ASSISTANT_RESPONSES=0. Decide those on purpose, and tell your team what you collect. The metrics do carry user.email when it’s known, so a dashboard names people unless you drop that label in the collector.
What OpenTelemetry won’t tell you
- Whether the work merged.
claude_code.pull_request.countcounts pull requests created, and nothing links a token or a dollar to one that merged, or to its review. For that you need to join to GitHub. - Anything outside Claude Code. Codex exports OpenTelemetry log events of its own, with different names, and Cursor and Copilot have their own APIs. A team on several agents has several pipelines.
- Sessions on machines you don’t manage. One laptop without the settings is a hole in the data. In the 30 days to October 3, our heaviest user’s laptop opened 68% of the pull requests we merged. The other 32% came from other engineers, other agents and other machines.
- What to do next. A dashboard is yours to build and to read.
Zest needs no collector. Each engineer adds a plugin that takes about a minute, sessions land on a team dashboard with models, tokens and an estimated cost, and the Zest GitHub App joins them to merged pull requests. It doesn’t read OpenTelemetry exports, so the two can run side by side. It also covers Codex, Cursor and Copilot Chat. It doesn’t replace an observability stack for alerts on your own terms. See how Zest tracks Claude Code usage and setup.
Frequently asked questions
Is Claude Code telemetry on by default?
No. OpenTelemetry export is off until you set CLAUDE_CODE_ENABLE_TELEMETRY=1 and choose an exporter with OTEL_METRICS_EXPORTER or OTEL_LOGS_EXPORTER. An admin can set these for everyone in the env block of the managed settings file.
Does Claude Code telemetry include my prompts?
Not by default. Prompt text and assistant responses are redacted unless you set OTEL_LOG_USER_PROMPTS=1, which also turns on responses unless you set OTEL_LOG_ASSISTANT_RESPONSES=0. Tool inputs and raw API bodies need their own opt-in variables.
How do I see Claude Code cost per engineer?
Group claude_code.cost.usage by user.email. Through a collector into Prometheus that is sum by (user_email) (max_over_time(claude_code_cost_usage_USD_total[7d])). It is an estimate at list price unless you set modelPricing. Team plans can also export the spend report CSV.
Why does increase() return 0 for Claude Code metrics?
Each session is its own series by default, because of the session.id label, and increase() doesn’t count a series’ first value. Use max_over_time() with cumulative export instead. Turning session IDs off isn’t the fix: in our test it undercounted by half or more, because the collector’s Prometheus exporter replaced values rather than adding them.
Is there a Grafana dashboard for Claude Code?
Yes. Grafana’s library lists a community dashboard, Claude Code Metrics (Prometheus), and Anthropic publishes a Claude Code monitoring guide on GitHub. Check which metric names a dashboard expects before you import it, since they differ between the direct exporter and a collector.
What is the difference between Claude Code monitoring and the Monitor tool?
Monitoring means exporting Claude Code’s usage to a system like Prometheus, so you can watch tokens and cost. The Monitor tool is something Claude uses during a session: it runs a command in the background and reacts to each line of output.