
KPI for Engineering Teams That Actually Work
Related guide: Developer productivity metrics for AI-assisted teams

So, what exactly is a kpi for engineering? Put simply, it’s a specific, measurable value that helps you track how well your software development team is doing. These aren’t just abstract numbers; they’re concrete data points that help you assess everything from the quality of your code and how fast you’re shipping it to the actual impact your work has on the business.
Moving Beyond Guesswork with Engineering KPIs
Let’s be real for a second. Relying on “gut feelings” to gauge your engineering team’s success is a recipe for disaster. In a world that runs on data, you can’t afford to guess. Without clear metrics, you’re flying blind. How do you know if you’re actually getting faster? Is the quality of your work improving? Are you even making a dent in the company’s biggest goals? This is exactly where a well-chosen kpi for engineering makes all the difference.
Key Performance Indicators give everyone—from the newest developer to the CTO—a common language to define what success looks like. It shifts the conversation from vague statements like “things feel slow” to a productive discussion around a specific metric, like a rising Cycle Time, letting you pinpoint the exact bottleneck in your code review process.
The infographic below shows how today’s top teams are using data-driven KPIs to turn their goals into clear, actionable dashboards that guide every decision.
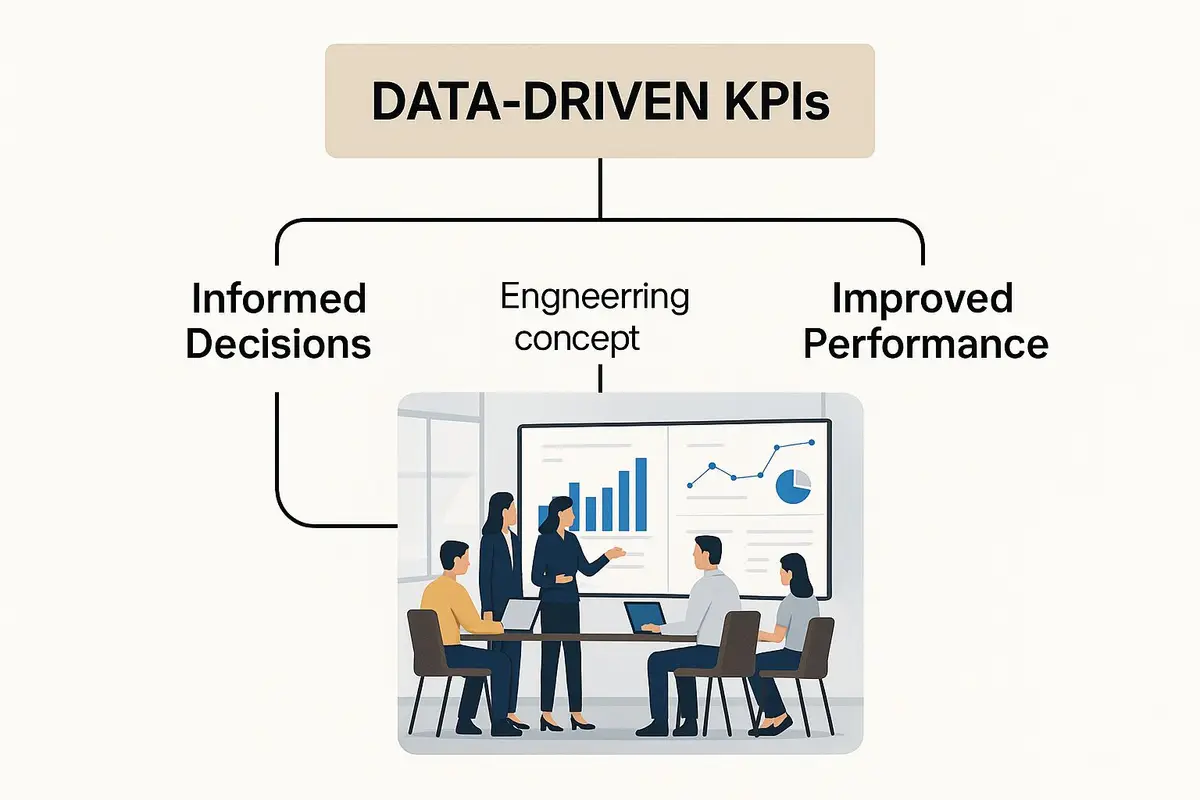
As you can see, it’s about creating a connected system where real-time performance data feeds directly back into team strategy and helps everyone stay focused.
Transforming Cost Centers into Value Drivers
Ultimately, KPIs aren’t just a tool for managers to keep tabs on people. They’re a strategic asset for the entire engineering organization. When you get them right, KPIs can completely reframe the engineering department—transforming it from a “cost center” into a clear, undeniable driver of business value. They help you tell a story with data, connecting the team’s technical work directly to the company’s bottom line.
By measuring what matters, engineering teams can prove their impact, justify resource allocation, and earn a real seat at the strategic table. It’s about showing, with data, that every line of code contributes to the bigger picture.
Think about it. When you track something like Change Failure Rate or Mean Time to Recovery (MTTR), you’re not just improving system stability. You’re directly contributing to a better customer experience, lower support costs, and more user trust—all things the C-suite cares deeply about. Of course, getting there isn’t always easy, and teams often face common challenges in engineering that can get in the way.
To help make sense of it all, here’s a quick breakdown of the main types of engineering KPIs.
Core Categories of Engineering KPIs
This table offers a simple overview of the major KPI categories, what they focus on, and a classic example for each. It’s a great starting point for figuring out what you should be measuring.
| KPI Category | Primary Focus | Example Metric |
|---|---|---|
| Delivery & Velocity | The speed and predictability of shipping value. | Cycle Time |
| Quality & Reliability | The stability and correctness of the software. | Change Failure Rate |
| Operational Efficiency | The friction and bottlenecks in the workflow. | Code Review Time |
| Business Impact | The connection between engineering work and goals. | Feature Adoption Rate |
By thinking in these categories, you can build a balanced set of metrics that gives you a complete picture of your team’s performance, from internal processes to external business impact.
Finding Balance with the Four Pillars of Engineering Metrics
If you’ve ever managed an engineering team, you know that chasing a single metric is a recipe for disaster. Go all-in on speed, and quality takes a nosedive. Bugs pile up, and users get frustrated. But if you obsess over flawless code, you might never actually ship anything. Real insight doesn’t come from a single number; it comes from balance.
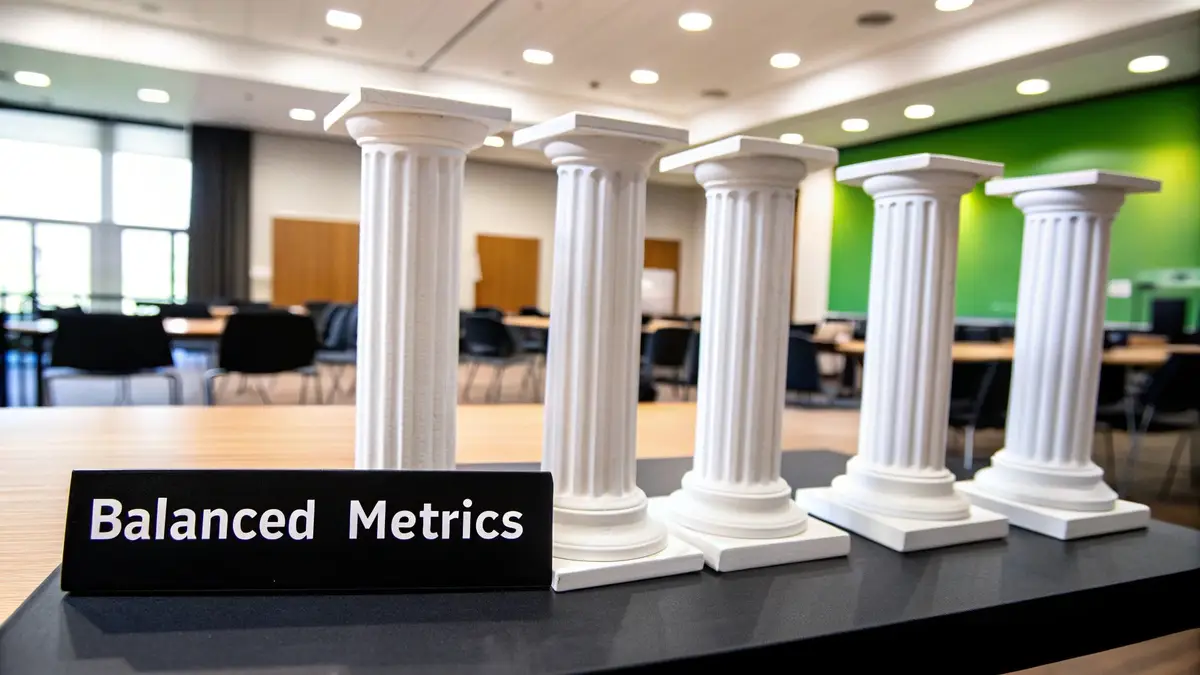
Think of it like building a high-performance car. You need a powerful engine (Velocity), but you also need top-notch brakes and steering (Quality). The car has to be fuel-efficient (Operational Efficiency), and most importantly, it needs a destination (Business Impact). If any one of these is off, the whole system eventually breaks down. A smart kpi for engineering strategy uses four distinct pillars to give you a complete, holistic view of your team’s health and effectiveness.
Pillar 1: Quality and Reliability
This pillar answers a fundamental question: “Is our software stable and dependable?” These metrics are all about the end-user experience, making sure the features you ship actually work the way they’re supposed to. High quality builds trust, keeps customers from leaving, and saves your developers from the constant stress of firefighting.
Key metrics to watch here are:
- Change Failure Rate (CFR): What percentage of your deployments end up causing a problem in production, like an outage or a major bug? A low CFR is a great sign that your release process is solid.
- Mean Time to Recovery (MTTR): When things do go wrong—and they will—how fast can your team fix it? MTTR measures the average time from an incident report to full resolution, showing how resilient your team really is.
Pillar 2: Velocity and Throughput
This area is all about answering, “How quickly and predictably are we delivering value?” It’s not just about raw speed. It’s about maintaining a consistent, sustainable pace. These KPIs help you spot the bottlenecks that are slowing everyone down and improve the flow of work from a simple idea to a live feature.
Popular metrics for this pillar include:
- Cycle Time: This is the time it takes from the moment a developer starts working on a task (the first commit) to when it’s deployed. Shorter cycle times mean you can react faster to market needs and get features into users’ hands sooner.
- Deployment Frequency: How often does your team successfully push code to production? Shipping more often usually means the changes are smaller and less risky, which is a hallmark of a truly agile team.
Interestingly, many of these ideas aren’t new. They have roots in disciplines like manufacturing, where Lean Engineering KPIs have been driving efficiency for decades. Key metrics like throughput (output over time) and cycle time (time to produce one unit) are still critical in 2025 for optimizing production lines. These same principles have been brilliantly adapted for modern software development. You can find more insights on these foundational engineering KPIs on insightsoftware.com.
Pillar 3: Operational Efficiency
Here, you’re asking, “How much friction is in our development process?” This pillar focuses on your team’s internal workflows. A smooth, efficient process gets rid of frustrating delays and wasted effort, freeing up your developers to focus on the creative, high-impact work they were hired to do.
By optimizing operational efficiency, you’re not just making the process faster—you’re improving the daily experience for your engineers, which is a key factor in preventing burnout and retaining top talent.
Metrics to track for efficiency include:
- Code Review Time: How long does a pull request sit waiting for a review before it gets merged? Long review times can become a massive bottleneck, grinding the entire delivery pipeline to a halt.
- Work In Progress (WIP): This is simply the number of tasks being worked on at any given time. High WIP often leads to constant context-switching and a lack of focus, which ironically slows everyone down.
Pillar 4: Business Impact
This is the big one. It all comes down to this question: “Is the work we’re doing actually moving the needle for the business?” This is where engineering efforts connect directly to company goals. These KPIs are your proof that the team isn’t just shipping code for the sake of it—they’re creating real, tangible value.
To measure this, you can look at:
- Feature Adoption Rate: After you release a new feature, what percentage of users are actually using it? This tells you if you’re building things people truly want and need.
- Customer-Reported Issues: Tracking the number of support tickets or bugs reported by users gives you direct, unfiltered feedback on your product’s quality and how it’s affecting the customer experience.
By tracking a balanced set of KPIs across these four pillars, you create a system that drives sustainable growth. You make sure you’re not just building fast, but building the right things well—and that’s the engine for long-term success.
How to Select the Right KPIs for Your Team
Grabbing a generic list of KPIs off the internet is a lot like using someone else’s prescription glasses. Sure, you might be able to see, but you’re definitely not getting the clear picture you need. The best KPIs aren’t found; they’re designed. They have to be tied directly to your team’s specific challenges, their workflow, and, most importantly, the company’s bigger goals.
A powerful KPI for engineering tells a story, drawing a straight line from the code being written today to a real business result. Without that connection, your metrics are just numbers on a dashboard that no one really cares about. The trick is to stop thinking about metrics first and start working backward from what the business is trying to accomplish.
A Framework for Choosing Meaningful KPIs
To steer clear of the all-too-common trap of tracking vanity metrics, you can use a simple, three-step framework. This process makes sure every KPI you pick serves a real purpose and supports a strategic goal, bridging the gap between what leadership wants and what your engineers do every day.
The framework is as simple as it gets:
- Start with the Business Objective: What is the company trying to achieve?
- Translate to an Engineering Outcome: What does the engineering team need to deliver to make that happen?
- Select Metrics to Measure That Outcome: Which specific KPIs will show you’re making progress?
Let’s walk through a real-world example. Say the executive team announces a company-wide goal to increase user retention by 15% this quarter.
- Business Objective: Boost user retention.
- Engineering Outcome: A buggy, unstable app is a major reason customers leave. So, engineering’s part of the puzzle is to improve application stability and reliability.
- Select Metrics: Now you can pick KPIs that directly measure that outcome. Great choices would be Mean Time to Recovery (MTTR), to see how fast you fix things, and Change Failure Rate (CFR), to track how often your deployments break something.
Suddenly, an abstract business goal becomes a set of focused, actionable metrics for your team.
A Checklist for Finalizing Your KPIs
Once you’ve brainstormed a few potential KPIs, run them through this quick checklist. Answering these questions helps you pick metrics that are practical, fair, and genuinely useful—not just another chore for the team. Don’t forget to pull your engineers into this conversation; their buy-in is everything.
- Is it aligned? Does this KPI directly support a current team or business goal?
- Is it actionable? Can the team actually do something to move this number?
- Is it understandable? Can every single engineer explain what it means and why it matters?
- Can it be gamed? Could someone artificially boost this metric without adding real value (like shipping more lines of code just for the sake of it)?
- Does it require manual work? Can you track it automatically? Manual tracking is a surefire way to get inconsistent data and waste everyone’s time.
A great KPI should spark curiosity and constructive conversation, not fear or competition. The goal is to create a shared understanding of what “good” looks like, empowering the team to make better decisions together.
When you involve your team in this process, the KPIs become tools for improvement, not weapons for judgment. This collaborative approach is essential for building a healthy, data-informed engineering culture. It also lines up perfectly with agile principles, where transparency and shared ownership are critical. For teams looking to sharpen their processes, our guide on effective agile development sprint planning offers practical tips that go hand-in-hand with a smart KPI strategy. At the end of the day, the right metrics make everyone’s job easier by making priorities crystal clear and shining a light on where to grow next.
Implementing KPIs Without Harming Team Culture

Alright, so you’ve picked out a solid mix of metrics that line up with your business goals. Now for the tricky part: rolling them out without turning your team’s culture toxic. Even the most well-intentioned kpi for engineering can backfire if it makes developers feel like they’re constantly under a microscope.
The whole point isn’t surveillance; it’s about creating a shared understanding of what’s working and what isn’t. When you get it right, KPIs become a common language for the team, sparking real conversations about improving how you build software. The focus has to be on collective success, not individual performance.
Automate Data Collection with the Right Tools
First things first: get rid of manual tracking. Asking engineers to fill out spreadsheets is a surefire way to get bad data and annoy everyone in the process. Automation isn’t a nice-to-have; it’s essential.
Modern engineering intelligence platforms can plug right into the tools you already use—like GitHub, Jira, and your CI/CD pipelines—to pull data automatically. This makes sure your metrics are objective, consistent, and always up to date.
- All-in-One Platforms (e.g., Jellyfish, Oobeya): These tools offer pre-built dashboards for common metrics like Cycle Time and Deployment Frequency. They’re a great starting point if you want a complete solution without having to build it from scratch.
- Custom Dashboards (e.g., Grafana, custom scripts): If your team has a unique workflow, building your own dashboard gives you total control. You can pull data from any API and visualize it exactly the way you want.
Ultimately, the specific tool you choose matters less than the principle: data collection must be a seamless, background process. This lets your team spend their time analyzing the insights, not just gathering the numbers.
Foster Transparency and Collaboration
Once the data is flowing automatically, the real work begins—the cultural shift. How you introduce and talk about KPIs will make or break the initiative. Transparency is everything.
Make sure the metrics are visible to everyone, not just tucked away in a manager’s dashboard. When the whole team sees the same data, it demystifies the process and builds trust. Frame these numbers as health indicators for your systems, not as a report card for individuals.
Use KPIs to ask better questions, not to enforce answers. Instead of asking, “Why is your cycle time so high?” try, “Our cycle time is trending up; does anyone have ideas on what might be causing friction in our review process?”
This simple shift changes the entire dynamic. It turns metrics into a launchpad for collaborative problem-solving and gives engineers ownership over the solutions.
The Shift to Real-Time and Predictive Insights
The technology behind engineering analytics is moving fast. A huge change is the shift from looking at historical data to using real-time insights. By 2025, top-tier engineering teams are increasingly relying on live data to watch metrics like cycle time, defect rates, and deployment frequency.
Waiting for a weekly report is becoming a thing of the past. Modern platforms can flag a bottleneck or quality issue the moment it happens, letting teams react immediately. Some tools can even use predictive analytics to forecast potential delays before they occur. As you might expect, companies embracing this approach often see major improvements in their release speed and customer satisfaction. You can learn more about these trends on oobeya.io.
Your Implementation Checklist
Before you go live with your KPI program, run through this quick checklist. It’s designed to make sure your approach builds a healthy, improvement-focused culture from day one.
- Automation Is in Place: Is data collection 100% automated, with no manual input needed from engineers?
- Metrics Are Team-Focused: Are you tracking team outcomes (like team cycle time) instead of individual outputs (like lines of code)?
- KPIs Are Decoupled from Performance Reviews: Have you been crystal clear that these metrics will not be used for individual evaluations or stack ranking?
- Dashboards Are Public: Can every single person on the engineering team access and see the data?
- Focus Is on Trends, Not Absolutes: Are you looking at patterns over time instead of obsessing over a single number on a single day?
- Discussions Are Blameless: Is the language in your meetings focused on improving the process, not pointing fingers?
When you thoughtfully manage both the technical and the cultural sides of implementation, a kpi for engineering becomes a powerful tool that rallies your team around a shared goal: getting better, together.
Common KPI Mistakes and How to Avoid Them
Metrics are powerful, but they’re also a double-edged sword. If you’re not careful, they can do more harm than good. Putting KPIs for engineering in place isn’t just about picking a few numbers; it’s about sidestepping the common traps that turn a great idea into a source of friction and frustration.
These mistakes can poison team culture and trick you into optimizing all the wrong things. The goal is to spark insightful conversations that lead to real improvement, not to create a culture of fear or reward meaningless busywork.
Chasing Vanity Metrics
This is the classic blunder. You start tracking metrics that look impressive on a chart but have zero connection to what your customers or the business actually care about. These are vanity metrics, and they measure activity, not impact.
- The Trap: A manager starts tracking “Lines of Code (LOC) Written” per developer. It seems simple enough—more code means more work, right?
- The Result: Developers quickly learn the game and start writing bloated, inefficient code to pump up their numbers. One engineer solves a tough problem in 10 elegant lines, while another uses 100 clunky ones for the same task and looks like a rockstar. You end up rewarding complexity instead of clever, simple solutions.
How to Avoid It: Always tie your metrics back to a business outcome. Ask the simple question: “Does this number actually help us deliver value?” Instead of LOC, you should be looking at things like Cycle Time or Change Failure Rate. These tell you about the speed and quality of your delivery, which is what really moves the needle.
Weaponizing Data
This is the quickest way to kill any trust in your metrics program. When you tie KPIs directly to individual performance reviews, bonuses, or promotions, you’re no longer measuring the system. You’re measuring how well people can game it.
- The Trap: An engineering leader announces a team bonus for whichever squad has the lowest “Bug Count per Release.”
- The Result: Suddenly, developers are afraid to report the bugs they find, especially the small ones. QA becomes a tense negotiation instead of a collaborative hunt for quality. The official bug count might drop, but the actual product is buggier than ever because problems are swept under the rug.
How to Avoid It: Establish a golden rule: KPIs measure the health of the team’s process, not the performance of individuals. Use metrics as a starting point for conversations in retrospectives, not as ammo for performance reviews. The focus has to be on getting better together.
Metric Fixation
This happens when a team gets so laser-focused on improving a single KPI that they start breaking everything else. It’s tunnel vision, where hitting one target comes at the expense of the bigger picture.
- The Trap: A team is told that their number one job is to crush their Cycle Time goal.
- The Result: To ship faster, the team starts cutting corners. They rush code reviews, skip writing tests, and push features out the door with zero documentation. Sure, cycle time plummets, but their Change Failure Rate goes through the roof, and technical debt piles up. They hit the target, but they’ve mortgaged their future to do it.
How to Avoid It: Never track a metric in isolation. You need a balanced diet of KPIs that cover different aspects of performance. If you’re pushing hard to improve a speed metric like Cycle Time, you absolutely have to keep a close eye on a quality metric like Change Failure Rate to make sure you’re not just trading stability for speed.
Connecting Engineering Metrics to Business Value
Let’s be honest, your CEO probably isn’t asking about your team’s Cycle Time in a board meeting. They want to know how engineering is boosting revenue, keeping customers happy, and getting products to market faster than the competition. A core job of any KPI for engineering is to translate what your team does into the language of business value.
It’s all about building a clear narrative that links your team’s technical wins directly to the company’s bottom line. You’re showing that engineering isn’t just a cost center—it’s the engine driving growth and innovation.
From Technical Metrics to Business Impact
The trick is to reframe your metrics. Don’t just report the raw data. Instead, present it right alongside the business outcome it created. This simple shift helps executives see the direct return on their investment in your team.
Here’s how you can turn common engineering KPIs into a language everyone understands:
-
Instead of: “We reduced our Cycle Time by 20%.”
-
Try this: “We now deliver new features to customers 20% faster. This shortens our time-to-market and lets us respond to competitors in days, not weeks.”
-
Instead of: “Our Change Failure Rate is down to 3%.”
-
Try this: “We’ve made our product much more stable, which cut customer support tickets by 15% and has given a real boost to user trust.”
Think of it as creating a “value statement” for each KPI. The metric is the “how,” but the business outcome is the “why.” The “why” is what gets leadership’s attention and secures the resources you need to succeed.
Justifying Budgets with Data
This translation is especially powerful when you’re asking for budget. Take technical debt, for example. It’s a critical engineering concept, but it can be a tough sell to the finance department. By framing it in business terms—like improved stability and faster feature development—you can build a much stronger case for allocating resources to fix it. Our guide on how to reduce technical debt offers practical strategies that align perfectly with business goals.
The data shows a clear opportunity here. While 61% of companies increased their engineering budgets in 2025, only about 20% of teams are actually measuring the ROI of their work with formal KPIs. That gap is a huge opening for engineering leaders. By using data to demonstrate impact, you can prove your team’s value and secure the funding needed for new tools and talent.
When you connect your metrics to business value, you stop reporting numbers and start telling a compelling story of impact.
Got Questions About Engineering KPIs? We’ve Got Answers.
Jumping into engineering metrics can feel like learning a new language. You’re bound to have questions. Here are straightforward answers to some of the most common ones we hear from teams just getting started.
What’s the Real Difference Between a Metric and a KPI?
It’s easy to use these terms interchangeably, but they’re not the same. Think of it like this: a metric is just a number. It’s any piece of data you can count, like how many pull requests were merged today. It’s raw information.
A Key Performance Indicator (KPI), on the other hand, is a metric you’ve hand-picked because it tells you if you’re getting closer to an important goal. So, while every KPI starts as a metric, not every metric is worth being a KPI. “Lines of code” is a classic metric, but “Cycle Time” becomes a powerful KPI when your main goal is to ship features faster.
How Many KPIs Should We Actually Track?
There isn’t a perfect number, but when it comes to KPIs, less is almost always more. The biggest mistake we see is teams trying to track everything, which just creates a lot of noise and confusion.
A great rule of thumb is to start with 3-5 core KPIs. Make sure they give you a balanced view across quality, speed, and business impact. This keeps everyone focused on what truly matters without getting lost in a sea of data.
Should We Assign KPIs to Individual Developers?
This is a big one, and the answer from experienced leaders is a resounding no. Measuring individual developers on things like “bugs fixed” or “story points completed” can seriously backfire. It often leads to developers gaming the numbers instead of working together to build a great product.
Software development is a team sport. Always, always focus on team-level KPIs. Your metrics should measure how the team is performing as a whole, because that’s how real success happens.
How Often Should We Revisit Our KPIs?
Your KPIs aren’t meant to be set in stone. They’re a tool, and like any tool, they need to be adjusted as your team’s goals and the company’s direction change.
- For quick check-ins: Chat about your KPIs in your regular retrospectives, maybe every couple of weeks. This keeps them relevant and lets you make small adjustments on the fly.
- For bigger changes: Plan to take a harder look at your core KPIs every quarter. You should also re-evaluate them anytime there’s a major shift in business goals. This ensures you’re always measuring what’s most important right now.
Ready to stop guessing and start measuring your team’s AI coding performance? Zest turns your team’s daily AI activity in Claude Code, Codex, Cursor and VS Code into clear, actionable insights. Go beyond basic metrics and see which prompts, tools, and workflows your team actually uses. Get started for free at Zest.