
Cycle Time Definition A Guide to Faster Delivery
Related guide: DORA metrics and AI coding
In simple terms, cycle time is the clock that starts the moment a developer picks up a task and stops only when that task is completely finished and delivered. It’s the true measure of your team’s internal velocity—how long it takes to turn an idea into a reality.
Think of it as the “hands-on” time for any given feature or bug fix. The stopwatch starts when work begins, and it keeps running through coding, testing, and review until the job is done.
What Cycle Time Reveals About Your Workflow
Imagine your development process is a workshop. The second a mechanic pulls a car into the bay to start working on it, the clock for cycle time begins. That clock doesn’t stop ticking until the car is fully repaired, tested, and ready for the customer to drive away.
In software development, this metric captures that entire journey. It’s not just the time spent writing code. It includes every active phase, like code reviews, testing, and even the time a task waits in a queue for the next person in the process.
Why It Matters More Than You Think
A short and, crucially, a predictable cycle time is the hallmark of a healthy, high-performing team. It tells you that work is flowing smoothly through your system without hitting roadblocks or getting stuck in long queues.
When your cycle time is low and consistent, your team gains some serious advantages:
- Faster Feedback: Getting features into the hands of users or testers more quickly creates tight learning loops that improve the final product.
- Better Forecasting: When you know how long things actually take, you can give stakeholders much more reliable estimates. No more guessing games.
- Improved Morale: A smooth workflow means less chaos and fewer last-minute fire drills. This leads to a more sustainable, less stressful environment for everyone on the team.
Cycle Time at a Glance
To make this crystal clear, let’s break down what’s typically included in the cycle time calculation for a software team.
| Component | Description | Example |
|---|---|---|
| Active Development | The time a developer spends writing code to solve the problem. | A developer spends 2 days coding a new login feature. |
| Code Review | The time a task waits for and undergoes a peer review. | The pull request sits for 1 day waiting for a review, and the review itself takes a few hours. |
| Testing/QA | The time dedicated to quality assurance and bug fixing. | The QA team spends 1 day testing the feature and finds a minor bug, which is quickly fixed. |
| Deployment | The final steps to merge the code and release it to production. | The code is merged and deployed, which takes about 4 hours. |
This table shows how each distinct phase contributes to the total cycle time. It’s the sum of all these active and waiting periods that gives you the full picture.
From the Factory Floor to Your Kanban Board
The idea of cycle time isn’t new; it has its roots in manufacturing, where it was a core metric for measuring process efficiency. On an assembly line, it’s the average time it takes to produce one unit. For instance, if a factory makes 100 widgets in 435 minutes, its cycle time is 4.35 minutes per widget—a vital number for planning and optimization.
Ultimately, a clear understanding of your cycle time is the first step toward improving your entire delivery pipeline. It’s one of the most powerful KPIs for engineering teams because it directly reflects your team’s ability to ship value, consistently and predictably.
How to Accurately Measure Your Cycle Time
Measuring your team’s cycle time isn’t some complex mathematical exercise. It really just comes down to setting clear, consistent rules for how your team tracks its work. If you don’t have precise start and end points for every task, you’re just tracking noise, not a useful metric.
Think of it like a relay race. The clock doesn’t start when the runner is thinking about running; it starts the second the baton is in their hand. For your team, cycle time begins the moment a task moves out of the backlog and someone actually starts working on it.
Defining Your Start and End Points
The very first step is getting everyone on the same page about what “Work Started” actually means. For most software teams, this is the trigger that pulls a ticket from a waiting column (like ‘To Do’ or ‘Ready for Dev’) into an active one.
- Start Point: The moment a developer pulls a task and moves its status to ‘In Progress’.
- End Point: The moment the work is truly done and delivering value. Typically, this means the code is merged into the main branch and pushed live.
It’s absolutely critical that these definitions are baked into your project management tool. If you rely on people to track this manually, you’ll end up with a mess of errors and inconsistent data.
The Basic Formula and Real-World Adjustments
Once you’ve locked in your start and end points, the calculation itself is refreshingly simple.
Cycle Time = Work Completion Date – Work Start Date
So, if a task moves to ‘In Progress’ on Monday morning and gets merged on Wednesday afternoon, its cycle time is about 2.5 days.
But we all know the real world is messy. What about weekends? What if a task gets blocked and put ‘On Hold’? The best practice here is to include all calendar days in your calculation—weekends, holidays, and any time spent in a ‘blocked’ status. This might feel a little strange at first, but it gives you an honest picture of how long work actually takes to get through your entire system, warts and all.
Moving Beyond Simple Averages
Calculating an average cycle time is a decent starting point, but it can be dangerously misleading. A single outlier, like a task that gets stuck for weeks, can blow up your average and give you a false sense of how predictable your team is.
To get a real feel for your workflow, you need to see the whole picture.
A Cycle Time Scatter Plot is perfect for this. It plots every single completed task as a dot, showing you exactly how long each one took. This kind of visualization instantly highlights patterns, clusters of similar tasks, and those pesky outliers.
From there, you can start using percentiles to make much more reliable forecasts.
- 50th Percentile: The time it takes for you to complete half of your tasks.
- 85th Percentile: The point at which 85% of your tasks are finished. This is a solid, trustworthy number to use when making commitments.
Using your 85th percentile lets you say, “We’re confident that a task of this size will be done within X days.” It’s a forecast backed by data, not a wild guess. This gives you a much clearer view than a simple average and helps you understand how to measure developer velocity with more accuracy, because it’s all about predictability, not just raw output.
Understanding Cycle Time vs Lead Time
In software development, you’ll often hear the terms “cycle time” and “lead time” thrown around, sometimes even interchangeably. But they measure two very different things, and getting the distinction right is key to understanding both your team’s efficiency and your customer’s experience.
Let’s use a simple analogy: ordering a pizza.
Lead Time is the full customer experience. It starts the second you hit “Confirm Order” on the app and doesn’t stop until the delivery driver is at your door, pizza in hand. It covers everything in between—the restaurant getting the order, the ticket sitting in a queue, the baking, and the delivery journey.
Cycle Time, on the other hand, is all about the “active work.” This clock only starts ticking when the chef actually grabs your ticket and starts tossing the dough. It measures how long it takes to make the pizza, from start to finish, and stops the moment it comes out of the oven.
This visual breaks it down nicely:
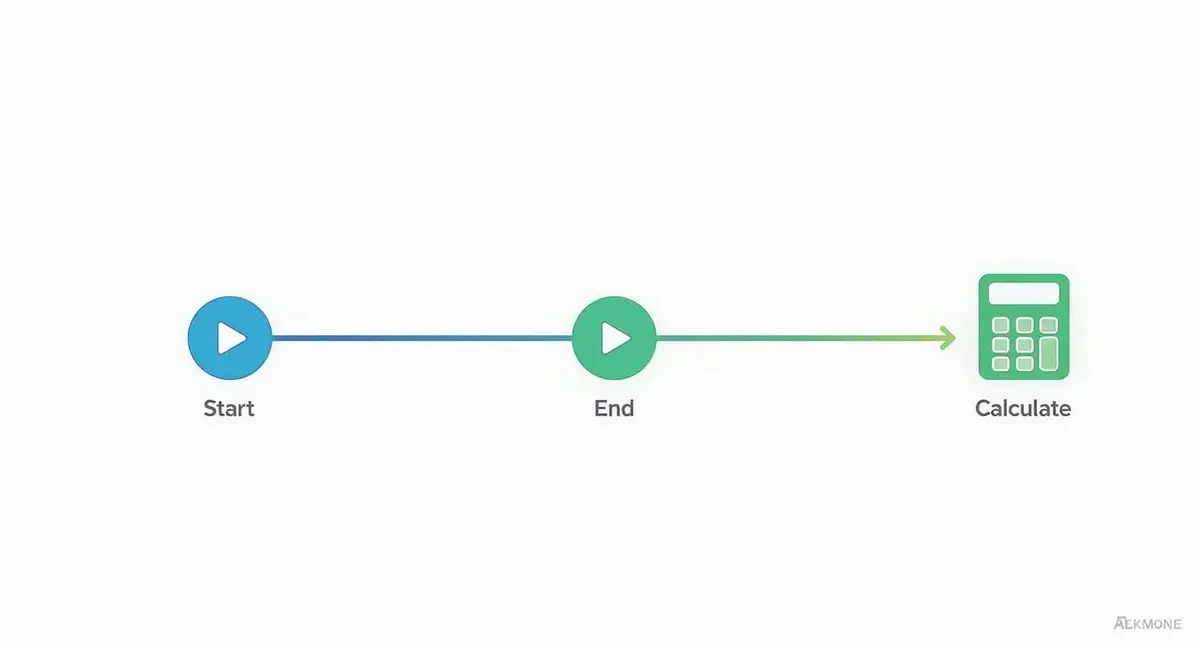
As you can see, cycle time is a specific slice of the much larger lead time. It’s the pure “production” phase.
The Customer’s Clock vs The Team’s Clock
The core difference really comes down to perspective. Lead time is all about the customer, answering their main question: “How long do I have to wait?” Cycle time is an internal metric for your team, answering the question: “Once we started, how long did it take us to get this done?”
Lead time measures the entire customer journey, from request to delivery. Cycle time measures your team’s internal process speed. A long lead time paired with a short cycle time is a classic sign that work is getting stuck in a queue before anyone even starts on it.
To help clear up any confusion, this table breaks down the fundamental differences between the two.
Cycle Time vs Lead Time A Clear Comparison
| Aspect | Cycle Time | Lead Time |
|---|---|---|
| Perspective | Internal team efficiency | External customer experience |
| Start Point | When active development begins on a task | When a task or feature is first requested |
| End Point | When the task is considered “done” (e.g., deployed) | When the feature is delivered to the customer |
| What It Measures | The speed of the development process | The speed of the entire value delivery system |
| Primary Use | Identifying bottlenecks within the workflow | Understanding responsiveness to customer needs |
This comparison makes it clear that while related, each metric tells a very different story about your process.
It’s also worth distinguishing cycle time from takt time, another term borrowed from lean manufacturing. While cycle time measures how long it takes to complete one item, takt time calculates the pace you need to maintain to meet customer demand. If you’re interested in the manufacturing origins of these concepts, you can discover more insights about cycle time in manufacturing on output.industries.
By getting a handle on both cycle and lead time, you get a complete picture of your delivery pipeline. You can see how fast your team builds (cycle time) and how quickly your entire system responds to what your customers want (lead time).
Proven Strategies to Reduce Cycle Time

Just measuring your cycle time gives you a number. The real magic happens when you start actively trying to improve it. High-performing teams don’t just watch this metric; they use it as a compass to hunt down waste and smooth out their delivery process. The idea is to build a system that delivers value quickly and predictably, over and over again.
This journey starts by looking at your workflow to find the biggest logjams. Is your code review process painfully slow? Do tickets pile up in a “Waiting for QA” column? Finding out where work spends most of its time sitting around is the first real step toward a shorter cycle.
Enforce Work in Progress (WIP) Limits
One of the most effective ways to slash your cycle time is to limit how much work your team tackles at once. By setting Work in Progress (WIP) limits, you force the team to focus on finishing tasks, not just starting new ones.
It can feel a little unnatural at first, but the results are undeniable. When developers aren’t constantly switching between tasks, they can concentrate and get things done faster. This simple constraint does more than speed up individual tickets; it shines a spotlight on the hidden bottlenecks that were buried under the chaos of having too much going on.
By focusing on fewer tasks at once, teams reduce context-switching, minimize wait states, and force bottlenecks to become visible. This creates a smoother, faster flow of work, which directly translates to a shorter average cycle time.
Break Down Large Features into Smaller Stories
Huge, complex tasks are notorious for creating long and unpredictable cycle times. A single epic that drags on for weeks can clog up your entire pipeline and starve the team of valuable feedback. The fix is to slice those big features into small, manageable user stories that can be delivered independently.
Smaller chunks of work just move through the system faster. This approach brings a few major wins:
- Quicker Feedback: Small tasks get reviewed, tested, and shipped in days, not weeks.
- Reduced Risk: A small story is easier to wrap your head around, meaning there’s less chance of introducing a major bug.
- Improved Predictability: When work items are roughly the same size, your cycle time becomes far more stable and predictable.
Automate Your Pipeline
Every manual step in your process is a breeding ground for delays and human error. Automating the key parts of your development pipeline—like builds, testing, and deployments—is a direct investment in a shorter cycle time.
A solid continuous integration and continuous delivery (CI/CD) pipeline ensures that once code is merged, it progresses toward production with little to no hand-holding. This gets rid of the queues and wait times, letting your team focus on what they’re actually paid to do: build great software.
The concepts for cutting down cycle time in software aren’t new; they echo principles from other fields. For example, manufacturing cycle time is the total time it takes to turn raw materials into a finished product, counting both the hands-on work and the idle time spent waiting. Just like in software, understanding where that time goes is key to spotting inefficiencies. This is a core part of any clear cycle time definition. To see how these ideas apply in another industry, you can learn more about manufacturing process efficiency on oden.io. By adopting these strategies, your team can build a more efficient, predictable, and ultimately faster workflow.
The Business Impact of a Shorter Cycle Time
https://www.youtube.com/embed/gsvFiW5cvIQ
Slashing your cycle time isn’t just an internal pat on the back for the engineering team—it’s a serious engine for business growth and a major competitive edge. When your development cycles are faster, your entire organization becomes more agile and responsive to the world around it.
Think about it: when your team can turn an idea into a working feature in a matter of days instead of months, you suddenly have the power to react to market shifts and customer feedback in near real-time. This kind of agility is how you get ahead of the competition, shipping new features and crucial fixes before they’ve even finished their planning meetings.
Creating Powerful Feedback Loops
Short cycles are the key to unlocking incredibly powerful feedback loops. Instead of building a massive feature in a silo for six months, you can ship small, valuable pieces of it. This lets you gather data from real users and pivot based on what they actually want and need.
This iterative process takes a massive amount of risk out of projects. You stop pouring resources into features that might fall flat and start ensuring that every bit of development effort directly answers a genuine user need.
Building Trust and Predictability
Beyond the product itself, a low and stable cycle time builds a huge amount of trust with everyone involved, from stakeholders to customers. When you can reliably predict when work will be delivered, you shift from making educated guesses to making data-backed commitments. This predictability is what ends the all-too-common chaos of last-minute crunches.
A stable, predictable workflow does wonders for team morale by creating a sustainable pace. It also solidifies confidence from leadership and customers, who see a team that consistently delivers on its promises.
This isn’t just a software thing, either. Cycle time is a core measure of operational health across many industries. One survey found that 70% of organizations tracking cycle time improved their overall lead times by at least 15%, with an impressive 45% seeing process delays shrink by over 30%.
Ultimately, getting a handle on cycle time is fundamental for any high-performing team. It’s also closely tied to other critical measures of engineering health. To see the full picture, it’s worth learning about the essential DORA metrics in our comprehensive guide.
Common Mistakes to Avoid When Tracking Cycle Time
Cycle time is a fantastic diagnostic tool for any engineering team. But like any powerful tool, it can cause a lot of damage if you don’t use it right. When teams fall into a few common traps, this incredibly helpful metric can turn into a source of stress and toxic behavior.
Knowing what not to do is just as important as knowing what to do. Let’s walk through the biggest pitfalls so you can use cycle time to drive positive change, not weaponize it.
Weaponizing the Metric
The fastest way to ruin your team’s culture is to use cycle time to compare or rank individual developers. This completely misses the point. Cycle time is a system metric—it tells you about the health of your process, not the performance of your people.
As soon as you tie cycle time to performance reviews, you’ll see developers do whatever it takes to get their numbers down. They’ll start cutting corners, shipping half-baked code, or only grabbing the easiest, quickest tasks. This creates a cutthroat environment focused on blame instead of a collaborative one where everyone wants to improve the team’s flow.
Remember, the goal of tracking cycle time is to fix the system, not to create a developer leaderboard. If a developer has a “slow” cycle time, it’s almost always a symptom of a bigger problem—maybe the task was way more complex than estimated, they’re blocked by another team, or the requirements were vague from the start.
Ignoring the Bigger Picture
Another classic mistake is obsessing over the average cycle time. Averages can be incredibly misleading because they’re easily skewed by a few outliers. One unusually long task can make your whole process look terrible, while a bunch of tiny bug fixes can make it look artificially fast.
To really understand what’s going on, you need to look at the distribution of your data. Tools like scatter plots and percentiles give you a much clearer picture. For instance, looking at your 85th percentile gives you a far more reliable forecast of what your team can consistently deliver.
This broader view helps you dig deeper. You can start analyzing things like non-value-added time (how long was that ticket just sitting there?) and parallel workstreams to get a more refined calculation. These kinds of cycle time reduction efforts have had a massive impact across industries. In automotive manufacturing, for example, it helped cut production time per vehicle by over 25% since the early 2000s. You can read more about how cycle time drives efficiency on mrpeasy.com.
Finally, you have to watch out for “gaming the metric.” This is what happens when a team changes its behavior just to make the numbers look good, without actually improving anything. A common example is splitting one big task into several smaller ones right before it’s finished. The cycle time data looks amazing, but no real value was delivered any faster.
The only way to prevent this is to treat cycle time as a conversation starter, not a final report card.
Got Questions About Cycle Time? We’ve Got Answers
Once you get the hang of what cycle time is, the real questions start popping up when you try to apply it to your team’s day-to-day. Let’s tackle some of the most common ones you’ll run into.
Think of this as your go-to guide for moving from theory to real-world practice.
What’s a Good Cycle Time for a Software Team?
This is the big one, and the answer is always: it depends. There’s no magic number or universal benchmark for a “good” cycle time.
A team that handles quick UI fixes will have a wildly different number than a team building out core backend services, and that’s completely normal. The ideal cycle time is unique to your team, your product’s complexity, and your tech stack.
Instead of chasing someone else’s number, focus on making your own cycle time stable and predictable. The real win isn’t hitting an arbitrary target; it’s achieving consistency and then working to bring that number down over time. That’s what proves your process is getting healthier and more efficient.
How Do Work-in-Progress Limits Affect Cycle Time?
Limiting your Work in Progress (WIP) is probably the most effective thing you can do to shorten your cycle time. It sounds backward—doing less to go faster—but it’s a game-changer.
When your team focuses on just a few tasks at once, you cut down on the mental drain of context-switching. Work stops sitting idle, waiting for someone to pick it up. Bottlenecks that were once hidden suddenly become impossible to ignore. This creates a smooth, continuous flow, which directly shrinks the average time it takes to get any given task across the finish line.
Does Cycle Time Include Code Review and QA Testing?
Yes, without a doubt. For cycle time to tell you anything useful about your delivery speed, it must track the entire journey from the first line of code to the final release. It’s not just about the time spent coding.
Your calculation needs to include every stage, including the time spent waiting between them:
- Initial development work
- Time a task spends waiting for code review
- The code review itself
- All quality assurance (QA) and testing phases
- Any final deployment steps
By looking at how long work spends in each of these columns, you can pinpoint exactly where things are getting stuck. That’s how you find your biggest opportunities for improvement.
Putting It All Together: A Practical Guide to Mastering Cycle Time
Think of this section as your cheat sheet. It’s designed to help you turn cycle time from just another number on a dashboard into your team’s most powerful tool for getting better every single day.
Core Metrics to Keep an Eye On
If you only track a few things, make it these three. They give you the clearest picture of your team’s workflow health.
- Average Cycle Time: This is your baseline—the typical time it takes for a task to go from ‘In Progress’ to ‘Done’.
- 85th Percentile Cycle Time: This is your secret weapon for predictability. It tells you the maximum time it takes to complete 85% of your tasks, giving you a delivery timeline you can actually trust.
- Work In Progress (WIP): Simply put, this is the number of tasks your team is juggling at any given moment.
My Go-To Rules of Thumb
Over the years, I’ve found these simple principles make the biggest difference.
- 🌱 Measure the Process, Not the People. Use cycle time to spot bottlenecks in your system. Is work getting stuck in code review? Is QA overloaded? It’s never about pointing fingers at individuals.
- 🦎 Know the Difference: Cycle Time vs. Lead Time. Remember, cycle time measures your internal engine—how fast you can build something. Lead time is the total waiting time from the customer’s perspective. They aren’t the same.
- ⚡ Want to Go Faster? Do Less. It sounds backward, but limiting your Work In Progress is the single most effective way to shrink your cycle time. Focus is speed.
Questions to Ask Your Team
Use these prompts in your retrospectives to spark meaningful conversations.
- 💡 Where do our tasks get stuck? Let’s identify the stages where work sits idle the longest.
- 🧩 Are we slicing our work small enough? Breaking big epics into small, consistently sized stories is key to a smooth, predictable flow.
- 📘 Is our “Definition of Done” actually done? Make sure everyone on the team has the exact same understanding of what it means to complete a task.
Your Pre-Sprint Checklist
Before you kick off the next sprint or iteration, run through these quick checks.
- 🔍 Take a look at your cycle time scatter plot. Do any tasks stand out as major outliers? Why did they take so long?
- 📊 Pinpoint the single biggest bottleneck from the last sprint. What one thing slowed you down the most?
- 🧭 Double-check your WIP limits. Are they still right for the team, or do they need adjusting?
- 📈 Agree on one small experiment to try this sprint aimed at cutting down on those wait times.