
Velocity in Agile: How to Calculate and Use It
Related guide: Developer productivity metrics for AI-assisted teams

In Agile, velocity is simply a measure of the amount of work a team gets done during a single sprint. Think of it in terms of story points or hours—it’s a number that represents a team’s output.
It’s not about how fast a team works, but about finding a predictable, sustainable rhythm. When a team knows its average velocity, they can look at the work ahead and forecast their progress with a whole lot more confidence.
What Is Velocity in Agile and Why Does It Matter?
Let’s use an analogy. If you’re planning a cross-country road trip, you wouldn’t estimate your arrival time based on your car’s top speed. That would be crazy. Instead, you’d use your average speed, factoring in things like traffic, gas stops, and detours.
Velocity is the exact same idea for a software team. It’s the team’s average, proven rate of completion. This gives everyone a realistic baseline for planning and forecasting what’s possible.
One thing to get straight: velocity is not a performance metric. You can’t use it to compare one team against another. Every team’s velocity is unique because it’s a reflection of their specific members, the complexity of their work, and even how they estimate. Its real value is in answering one simple question: “Looking at what we’ve done before, how much work can we realistically finish in our next sprint?”
The Core Purpose of Velocity
At its heart, velocity is a powerful tool for planning and a fantastic feedback loop. For engineering managers and product owners, it’s how they set goals that are actually achievable and keep stakeholder expectations grounded in reality. A stable velocity is a sign of a healthy, predictable team. If the numbers are all over the place, it’s usually a signal that something is going on under the hood that needs a closer look.
For a quick breakdown, here are the main components of velocity:
Understanding Velocity At a Glance
| Concept | Description | Primary Use Case |
|---|---|---|
| Velocity | A measure of the amount of work a team completes per sprint (e.g., in story points). | Forecasting how much work the team can complete in future sprints. |
| Sprint | A short, time-boxed period when a team works to complete a set amount of work. | Provides the consistent time-frame for measuring velocity. |
| Story Points | A relative unit of measure to estimate the effort required to complete a backlog item. | The most common “unit” for calculating velocity. |
This simple metric is foundational to how modern software teams operate. In fact, surveys show that 61% of Agile practitioners track velocity regularly, making it one of the most trusted metrics out there for keeping delivery on track. You can read more about how this predictability leads to better outcomes in our guide on the benefits of Agile software development.
Velocity is a conversation starter, not a final judgment. A sudden drop isn’t a failure; it’s an invitation to ask, “What changed, and what did we learn?” It transforms planning from guesswork into a data-informed dialogue.
Ultimately, understanding and using velocity is about building trust. It empowers a team to make commitments they can actually keep—both to the business and to themselves. And as AI coding assistants start changing how we work, a stable velocity becomes even more important for figuring out if these new tools are truly making a difference or just adding noise.
How to Calculate and Track Your Team’s Velocity
Knowing what velocity is conceptually is the easy part. The real magic happens when you start calculating and tracking it, turning an abstract idea into a practical tool for planning and forecasting. It all boils down to a simple formula and consistent habits.
The calculation itself is incredibly straightforward. A team’s velocity is just the sum of story points for all user stories they fully complete in a single sprint. And by “fully complete,” I mean meeting every single item on your team’s Definition of Done. If a story is half-done or 99% done, it counts for zero points in that sprint’s total. This isn’t about being harsh; it’s about creating a culture where “done” means done.
Let’s look at a quick example. A team wraps up a two-week sprint and has completed three user stories:
- User Authentication Feature: 5 points
- API Integration Update: 8 points
- Fix User Profile Bug: 3 points
You just add them up. Their velocity for that sprint is 16 points (5 + 8 + 3). That number is a simple, clean snapshot of what they delivered.
Establishing a Stable Baseline
Of course, the velocity from a single sprint is just one data point, not a trend. One sprint might be fantastic, hitting 20 points, while the next gets derailed by unexpected issues, finishing with only 12. This is normal. To get a number you can actually rely on for forecasting, you need to find the average.
Most experienced teams will tell you to average your velocity over the last 3 to 5 sprints. This simple act smooths out the peaks and valleys, giving you a much more stable and realistic baseline for planning what you can take on next. If you’re a new team, it might take a few sprints to get this average established, but the predictability you gain is well worth the wait.
The Power of Story Points and Relative Sizing
The most common unit for velocity is the story point. This is a deliberate choice. Unlike tracking hours or days, story points are a relative measure of effort, complexity, and uncertainty all rolled into one. It’s a powerful abstraction because it decouples the estimate from the clock, which is often a source of stress and inaccuracy.
The team isn’t asked, “How many hours will this take?” Instead, the question becomes, “How big is this task relative to other things we’ve done?” This keeps the focus on the work itself. While velocity gives you a big-picture view of team output, it’s also helpful to know how long individual tasks take to get through your workflow. For more on that, our guide on what cycle time is explains how it perfectly complements velocity.
The diagram below shows this simple, repeatable flow in action.
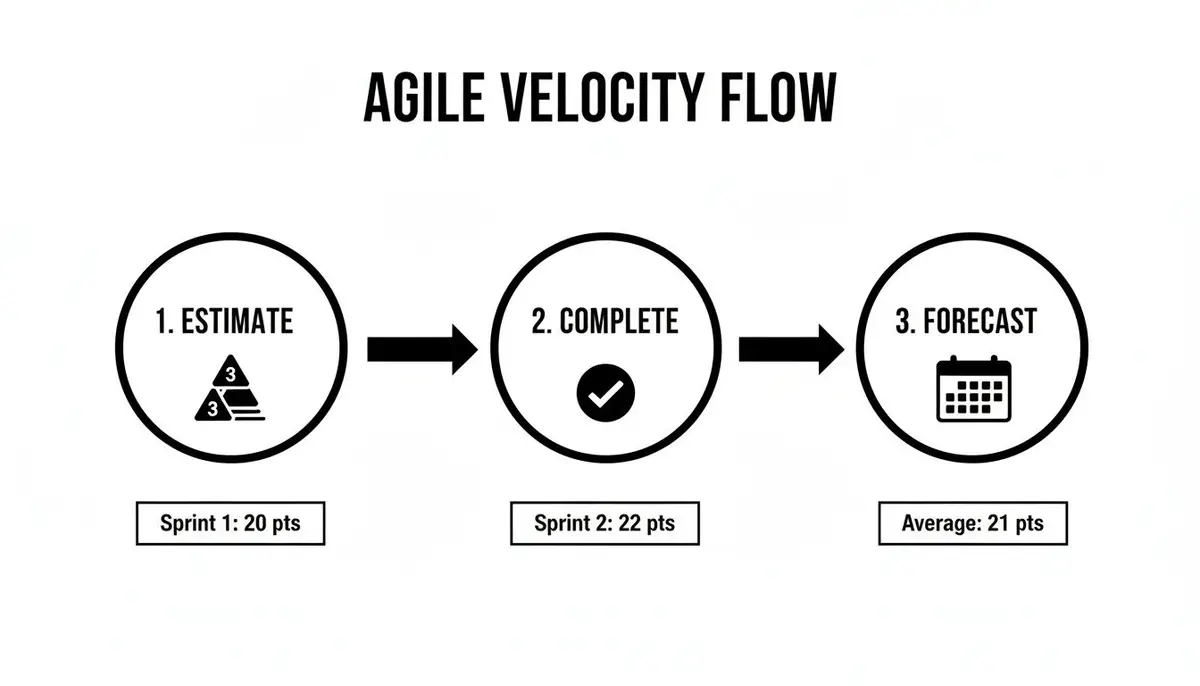
This process isn’t a one-and-done calculation. It’s a continuous cycle: estimate the work, complete it to a high standard, and then use that data to make smarter forecasts.
Essential Tracking Practices
To make sure your velocity is a meaningful metric, you have to be disciplined in how you track it. Here are two non-negotiable practices every team should live by:
- Use a Velocity Chart: Pretty much any agile project management tool (like Jira or Azure DevOps) has a built-in velocity chart. It’s usually a simple bar graph showing the points completed in each sprint. This visualization makes it incredibly easy to see your average, spot trends, and identify any outlier sprints that might be worth discussing.
- Adhere Strictly to Your Definition of Done (DoD): Your DoD is the ultimate checklist for quality. It defines what it means for work to be truly finished—things like “code reviewed,” “all tests passed,” and “deployed to staging.” By enforcing your DoD without exception, you ensure that every story point represents a consistent level of quality, making your velocity a reliable and trustworthy metric.
A team’s velocity is its historical record of what it can accomplish under real-world conditions. It’s not a target to be chased, but a mirror reflecting the team’s actual, sustainable pace. Tracking it honestly is the first step toward building a predictable and trustworthy delivery engine.
Using Velocity for Realistic Planning and Forecasting
Once your team establishes a stable, averaged velocity, it stops being just a report card on the past and becomes a crystal ball for the future. This is its real power. Velocity grounds your plans in reality, pulling you away from wishful thinking and toward deadlines you can actually hit.
For short-term planning, velocity acts as a simple capacity check for your next sprint. If your team consistently finishes around 30 story points, trying to cram 45 points into the upcoming sprint is just asking for burnout and missed goals. Instead, the team can confidently pull in work that lines up with that 30-point average, creating a healthy, sustainable pace.
This data-driven approach is the best defense against overcommitment, a huge source of stress and low morale on any development team.

Forecasting Long-Term Releases
Looking beyond the next couple of weeks, velocity becomes your go-to for long-range forecasting. Let’s say you have a major release planned, and the backlog for it adds up to 150 story points. If your team’s average velocity is 30 points per two-week sprint, the math is refreshingly simple.
Release Forecast Formula:
Total Backlog Story Points ÷ Average Velocity = Number of Sprints Required
In our example, that’s 150 points ÷ 30 points/sprint = 5 sprints. Just like that, you know the release is roughly ten weeks away. This isn’t a promise set in stone, but it’s a whole lot better than a date pulled out of thin air. It gives product owners a realistic timeline to share with stakeholders, setting expectations from the get-go.
The Power of Communicating Velocity as a Range
Here’s where many teams stumble: they treat velocity as a single, perfect number. But development is messy. A surprise bug, a sick team member, or a story that’s more complex than it first appeared can all cause fluctuations. The smarter, more honest approach is to talk about velocity as a range.
For instance, if your team’s last five sprints looked like 28, 35, 31, 26, and 30, the average is 30. Instead of just saying “our velocity is 30,” it’s far more insightful to say it’s typically between 26-35 points.
This one small change in how you communicate makes a huge difference:
- Manages Expectations: It shows stakeholders that software development has natural ups and downs, so they don’t treat your average as an unbreakable promise.
- Builds Trust: Being upfront about uncertainty shows you’re grounded in reality, not just optimism.
- Reduces Pressure: It prevents the team from getting grilled over one slightly lower-than-average sprint, as long as they’re still within their typical range.
The data backs this up. Teams that track velocity well see real results, with studies showing 40% improved estimation accuracy. This leads to a 75% project success rate for Agile teams, compared to just 56% for traditional waterfall projects. Using a range is a key part of these Agile velocity best practices because it accounts for normal variations and keeps everyone focused on the bigger picture.
Using Velocity to Drive Strategic Conversations
At the end of the day, velocity is a tool for having better conversations. When a forecast shows a release date that’s later than everyone hoped, it shifts the focus from “work faster!” to making smart trade-offs.
Instead of asking, “How can we increase velocity?”, the right questions become:
- “To hit that deadline, what scope can we cut from this release?”
- “Are there any lower-priority features we could push out to the next release?”
- “What’s the real business impact of shipping this in ten weeks instead of eight?”
This turns velocity from a simple metric into a strategic lever. It sparks a healthy, data-driven dialogue between the development team and the business, ensuring decisions are based on what’s actually possible.
Common Velocity Pitfalls and How to Avoid Them
Velocity is a fantastic tool for getting a handle on predictability, but it’s also one of the most misunderstood and misused metrics in the Agile world. When it’s used the wrong way, it can do more damage than good, breeding mistrust and crushing team morale.
Knowing the common anti-patterns is the first step to using velocity as it was meant to be used: as a private, reflective tool for the team, by the team. Nearly every pitfall comes from one core misunderstanding—treating velocity like a productivity report card instead of a simple planning compass.
Mistake 1: Using Velocity as a Performance Metric
This is probably the most destructive way to misuse velocity. It happens when managers start asking questions like, “Why did your velocity drop this sprint?” or start tying rewards to “higher velocity.” As soon as this happens, you’ve accidentally incentivized all the wrong behaviors.
Teams will naturally go into self-preservation mode. They might start padding their story point estimates to make it look like they’re getting more done. Quality takes a nosedive as they rush to cram more stories into a sprint, and technical debt starts piling up in the corners. Before you know it, the metric is completely useless because it no longer reflects a real, sustainable pace.
How to Avoid It: The fix is straightforward but requires discipline. Velocity is a number that belongs to the team, and only the team. It’s for their own internal planning and forecasting, period. Managers should shift their focus to the outcomes and the value being shipped, not the raw number of points.
Mistake 2: Comparing Velocity Between Different Teams
This one is incredibly common. An executive glances at a dashboard and asks, “Team A’s velocity is 40, but Team B is only hitting 25. What’s going on with Team B?” This comparison is fundamentally broken and makes no sense.
Story points are relative and unique to the team that created them. Team B’s “25 points” could easily represent work that is far more complex or uncertain than Team A’s “40 points.” There’s no universal exchange rate for story points. Making these comparisons just creates unhealthy competition and resentment, essentially punishing teams for being honest in their estimations.
How to Avoid It: Take the time to teach stakeholders that velocity is team-specific. Make it clear that its real power comes from tracking a single team’s trend over time. Instead of comparing the raw numbers, ask better questions. Is Team A’s velocity stable? Is Team B delivering on their forecasts? That’s what actually matters.
Mistake 3: Pressuring Teams to Constantly Increase Velocity
There’s a dangerous myth that a “good” team’s velocity should always be going up. Sure, a new team will likely see their velocity climb as they find their groove and sort out their processes. But a mature, high-performing team’s velocity will usually level off and stabilize. That’s not a bad sign—it’s a great one! It means they’ve found a sustainable, predictable rhythm.
Pushing for endless increases is like forcing a team to sprint a marathon. They’ll inevitably have to cut corners, skimp on testing, or burn themselves out chasing a number that was never meant to be a target.
Velocity is not a gas pedal you floor to go faster. Think of it as a speedometer on a long road trip. The goal isn’t to redline the engine; it’s to find a steady, reliable speed that will get you to your destination without the car breaking down.
How to Avoid It: Celebrate stability. A team that consistently delivers 25 points every sprint is far more valuable for planning than a team that swings wildly between 15 and 45. Focus your energy on removing obstacles and smoothing out the workflow. Those improvements might naturally lead to small, sustainable gains in velocity, but you get there without making the number itself the goal.
To keep these ideas straight, here’s a quick reference guide on the right and wrong ways to think about velocity.
Velocity Do’s and Don’ts
| Healthy Practice (Do) | Harmful Anti-Pattern (Don’t) |
|---|---|
| Use velocity for internal team forecasting. | Use velocity as an individual or team performance metric. |
| Track a single team’s velocity trend over time. | Compare the velocity numbers of different teams. |
| Focus on achieving a stable, predictable velocity. | Pressure the team to constantly increase their velocity. |
| Use velocity to facilitate scope trade-off discussions. | Weaponize velocity drops to question a team’s commitment. |
Stick to the “Do’s” column, and velocity will remain a healthy, helpful tool for your team’s planning efforts.
Scaling Velocity for Broader Organizational Insight
Once a team gets a good handle on its velocity, a question almost always bubbles up from leadership: “How can we use this across the whole company?” It’s a great question. The goal is to scale up from team-level predictability to something that helps the entire organization plan better. But be warned—this path is loaded with the same traps that trip up individual teams, only magnified.
Scaling velocity isn’t about mashing everyone’s story points together into one big, meaningless number. It’s about spotting trends and patterns across many teams to get a clearer strategic picture. Think of it as a way to find systemic roadblocks, make smarter decisions about resources, and help teams collaborate more effectively.
The key is to shift focus away from comparing raw velocity numbers—which is always a bad idea—and look at healthier, more insightful metrics instead.
Beyond Raw Numbers: Complementary Metrics for Scale
To get a real sense of your organization’s health, you need to look at velocity alongside other key indicators. These complementary metrics add the context that raw numbers are missing, helping you understand the why behind the what.
- Stability (or Predictability): How consistent is a team’s velocity sprint over sprint? A team that reliably delivers between 25-30 points is far more predictable than one swinging wildly from 10 to 50. When you see instability across the organization, it’s a huge red flag for systemic issues like too much unplanned work or unresolved dependencies between teams.
- Focus Factor: This metric cuts right to the chase: what percentage of a sprint is spent on planned, committed work versus last-minute fires like critical bugs or urgent requests? If you see a low focus factor across multiple teams, it’s a clear sign that constant context switching is killing productivity and firefighting has become the default mode.
- Linearity: This looks at the flow of work inside a sprint. Are teams steadily knocking out tasks, or is there a mad dash in the final few days to get things over the line? Poor linearity often points to hidden blockers or flawed estimation practices that need to be addressed.
These metrics tell a much richer story than velocity alone ever could. They help build a culture where data informs decisions and trends guide strategy—from the bottom up, not the top down.
Aggregating Data for Strategic Advantage
When you start combining these metrics, you can uncover powerful organizational patterns. For instance, if you notice that several teams saw their velocity dip and their focus factor drop during the same sprint, it almost certainly points to a cross-cutting problem, like a major infrastructure failure or a poorly timed company-wide event.
This is how velocity transforms from a simple team-level tool into a real strategic asset. A fascinating case study from Scrum@Scale showed a tech startup that used aggregated velocity data to go from chaos to predictable delivery. They sustained an average velocity of 1,250 story points across their organization for nearly two years with only a 10% margin of error. How? By using metrics like linearity and stability to drive their decisions. Discover more insights about their data-driven approach on Scrumatscale.com.
At scale, velocity trends become the organization’s early warning system. They don’t tell you who is ‘fast’ or ‘slow’; they show you where the system itself is creating friction, slowing everyone down.
By focusing on these patterns, engineering leaders can finally get ahead of dependency management, justify investments in new tools or training, and build a more resilient and predictable delivery engine. To go even deeper into measuring engineering performance, check out our guide on what DORA metrics are and see how they work alongside Agile practices. This empowers teams to build predictability from the ground up, instead of being micromanaged from the top down.
Optimizing Velocity in the Age of AI-Assisted Coding
The rise of AI coding assistants is shaking up how we build software. These tools can dramatically speed things up, but they also toss a new variable into the velocity equation. How can a team accurately track its pace when AI is writing, refactoring, or debugging a good chunk of the code?

The key is getting a clear picture of this new workflow. Sure, AI is great for spitting out boilerplate code or creating unit tests in a flash. But it also adds new kinds of work. Developers now spend a lot of time double-checking AI suggestions, hunting down subtle bugs in generated logic, and tweaking prompts to get the right results.
This “AI overhead” is a huge deal. If you don’t track it, that promised productivity boost can quietly turn into a drag on your team’s capacity, making your velocity numbers misleading.
Surfacing the True Impact of AI on Velocity
To really get a handle on this, teams need to look beyond just story points. It’s time to start measuring the AI-assisted workflow itself. The goal isn’t just to see how much code gets written, but to understand how time spent interacting with AI translates into finished work.
AI doesn’t just change how code is written; it changes the nature of the work itself. True velocity optimization in this new era means understanding the entire feedback loop—from prompt to validation to final commit—not just the speed of code generation.
By digging into metrics from tools that track AI coding sessions, you can start spotting patterns. You’ll see which tasks get a real boost from AI and which ones just lead to endless validation cycles. To learn more about this dynamic, it’s worth exploring how AI-assisted software development is reshaping the industry.
From Individual Gains to Team-Wide Predictability
Ultimately, you want to turn those individual moments of AI-fueled productivity into a stable, predictable team velocity. This means being deliberate about standardizing what works and learning from what doesn’t.
Here are a few practical steps to tie your team’s AI use back to its velocity:
- Share the “Cheat Codes”: Get developers to document and share the prompts and workflows that save them a ton of time on common tasks. Think of it as a team playbook for using AI effectively.
- Analyze AI Session Data: Use your tools to see where people are getting stuck. Are they writing weak prompts? Spending too long debugging AI output? These are coaching opportunities.
- Talk About It in Retrospectives: Make AI a regular topic in your retros. Discuss specific examples where it was a huge help and where it caused headaches. Use that feedback to fine-tune your team’s approach.
When you make the impact of AI visible, you can start adjusting your estimation and planning. Over time, your story point estimates will become a more honest reflection of the real effort involved in AI-assisted work. This stabilizes your velocity and makes it a reliable forecasting tool once again, ensuring AI is an asset, not a disruption.
Common Questions About Agile Velocity
Once you start using velocity, the real-world questions pop up pretty quickly. Let’s walk through some of the most common ones teams grapple with.
What’s a Good Velocity for a Scrum Team?
This is easily the most asked question, and the answer is always the same: there’s no such thing as a “good” number that applies to every team. Velocity is entirely unique to your team—it’s a reflection of your people, your product, and how you estimate work together.
A truly “good” velocity is simply a stable and predictable one. That stability is what makes forecasting possible. You aren’t chasing a higher number; you’re looking for a consistent trend. Honestly, a team that reliably delivers 20 points every sprint is far more valuable for planning than a team that swings from 10 to 50. Predictability wins every time.
Should We Include Bugs and Chores in Our Velocity Calculation?
Absolutely. If it takes up your team’s time and effort, it should be part of the calculation. This means estimating and tracking bugs, technical chores, and infrastructure work right alongside new features. If you don’t, you’re looking at a skewed, incomplete picture of your team’s actual capacity.
Many of the best teams I’ve worked with assign story points to bugs and chores just like they do for user stories. The most important thing here is consistency. Decide as a team how you’ll handle this kind of work and stick to that agreement. That’s how you keep your velocity trend meaningful.
How Do Team Member Changes Affect Velocity?
Velocity is incredibly sensitive to team changes. When you add a new person, expect velocity to dip for a bit. It’s natural. The team has to adjust, and the new hire needs time to get familiar with the codebase and the team’s way of working.
The same thing happens when someone leaves or just goes on vacation—the team’s capacity for that sprint is lower, so the velocity will be too. The key is not to panic. Just make a note of the reason for the change on your velocity chart (e.g., “Jane on vacation”). After a few sprints, the velocity will level out and find its new, stable baseline for the current team.
Can Velocity Increase Over Time?
Yes, and it often does, especially when a team is new. As a team gels, they get better at communicating, refining their process, and working within their codebase. It’s a natural outcome of collaboration and learning.
But remember, the goal is always predictability, not just a higher number. A mature team’s velocity will eventually plateau. This is a good thing! It means they’ve found a sustainable, healthy pace. Pushing for constant increases is a classic mistake that just leads to burnout, sloppy work, and teams gaming their estimates.